Bullish Signals for Bitcoin in 2023

Bitcoin (BTC) has experienced a minor dip in its ticker, settling at $28,385, yet it continues to maintain essential support levels, as suggested by a recent analysis that enhances the prospects of a bullish reversal. In a recent thread posted on X, formerly known as Twitter, on October 17, Caleb Franzen, a senior analyst at Cubic Analytics, highlighted two moving averages that are currently forming the battleground for Bitcoin's price.
Persevering Bitcoin support signifies a positive development
The analysis reveals that Bitcoin finds itself in a rather snug position between the 200-week simple moving average (SMA) and the 200-week exponential moving average (EMA), as indicated by TradingView data. These two trendlines, with prices at $28,277 and $25,744 respectively as of October 18, have been steadfastly serving as both support and resistance levels since mid-August.
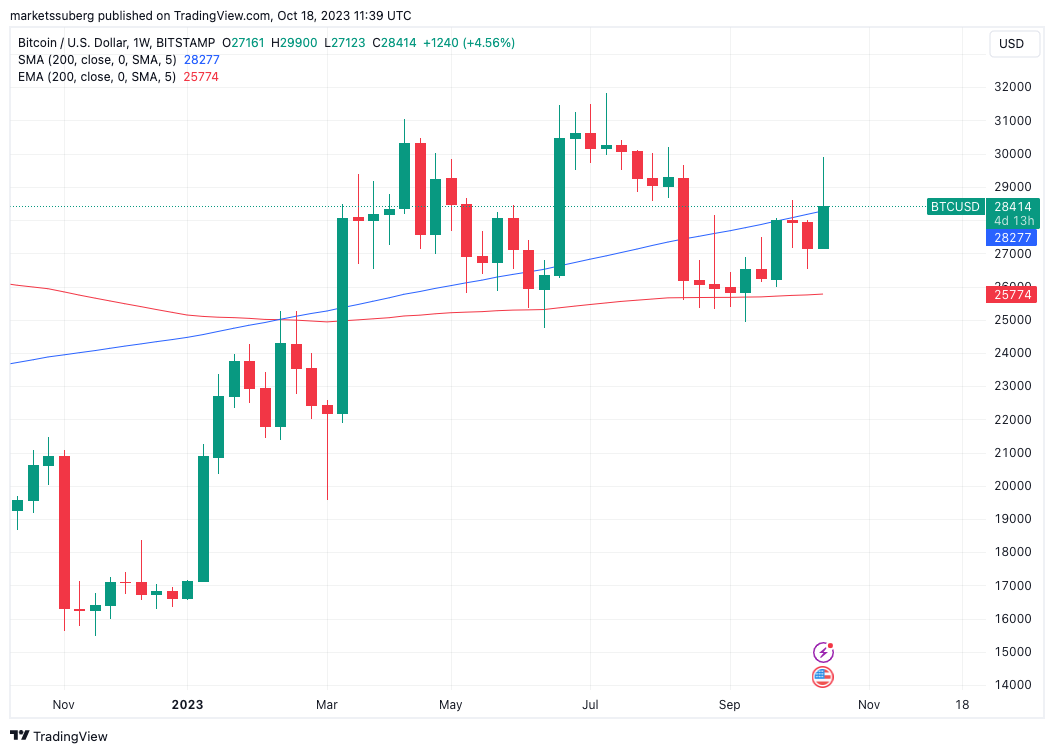 BTC/USD 1-week chart with 200-week SMA, EMA. Source: TradingView
Franzen regards this as an intriguing facet when scrutinizing weekly timeframes and sees it as one of the numerous positive aspects of the BTC/USD chart. He expressed in one of his posts, "One of the reasons why I've retained a patient approach to $BTC, despite my somewhat defensive stance, is the consistent use of the 200-week moving average cloud as a support layer," underscoring the importance of successfully maintaining the 200-week EMA as a "promising sign."
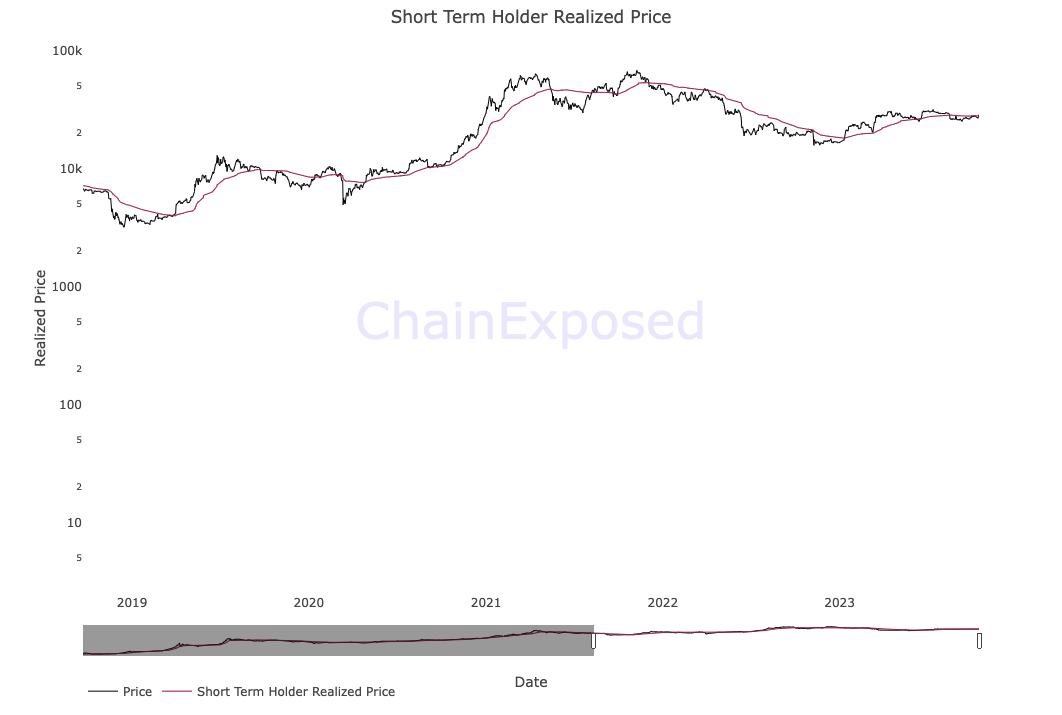
Franzen also alluded to the short-term holder realized price (STHRP), representing the aggregate on-chain price at which recently transacted coins, owned by younger investors, were most recently exchanged. Presently hovering around $26,900, this metric has garnered significant attention throughout 2023 due to its role as a source of market support.
The thread went on to elaborate, stating, "The price is showing a decisive break above the STHRP, a defining characteristic of an uptrend, with a proven track record of serving as dynamic support," supported by data from the on-chain analytics resource ChainExposed.
 Bitcoin short-term holder realized price (STHRP) chart (screenshot). Source: ChainExposed
Franzen emphasized that, despite these indicators, there is no definitive assurance that BTC's price action will replicate the surge seen in a bull market. He clarified, "On the whole, these indicators indicate constructive dynamics and improved odds of a bullish outcome, without providing an absolute guarantee of an upward price trajectory but pointing to positive developments."
BTC price cycle experiences a familiar déjà vu
These cyclic patterns in BTC's price behavior resonate with previous insights into Bitcoin's on-chain activities. Despite brief disturbances in the market, BTC/USD has maintained a 6% increase over the course of this week, while network fundamentals have reached new all-time highs. Expectations are building as Bitcoin approaches the April 2024 block subsidy halving.
Among the more optimistic voices in the community, social media trader Moustache has been drawing intriguing parallels between Bitcoin's performance in 2023 and that of 2020. A chart shared on X vividly portrays the resemblance between the cross-market crash in March 2020, attributed to the outbreak of COVID-19, and Bitcoin's lows subsequent to the FTX meltdown at the close of 2022. The accompanying commentary prompts consideration of whether this uncanny similarity might foretell a significant price movement in the near future.
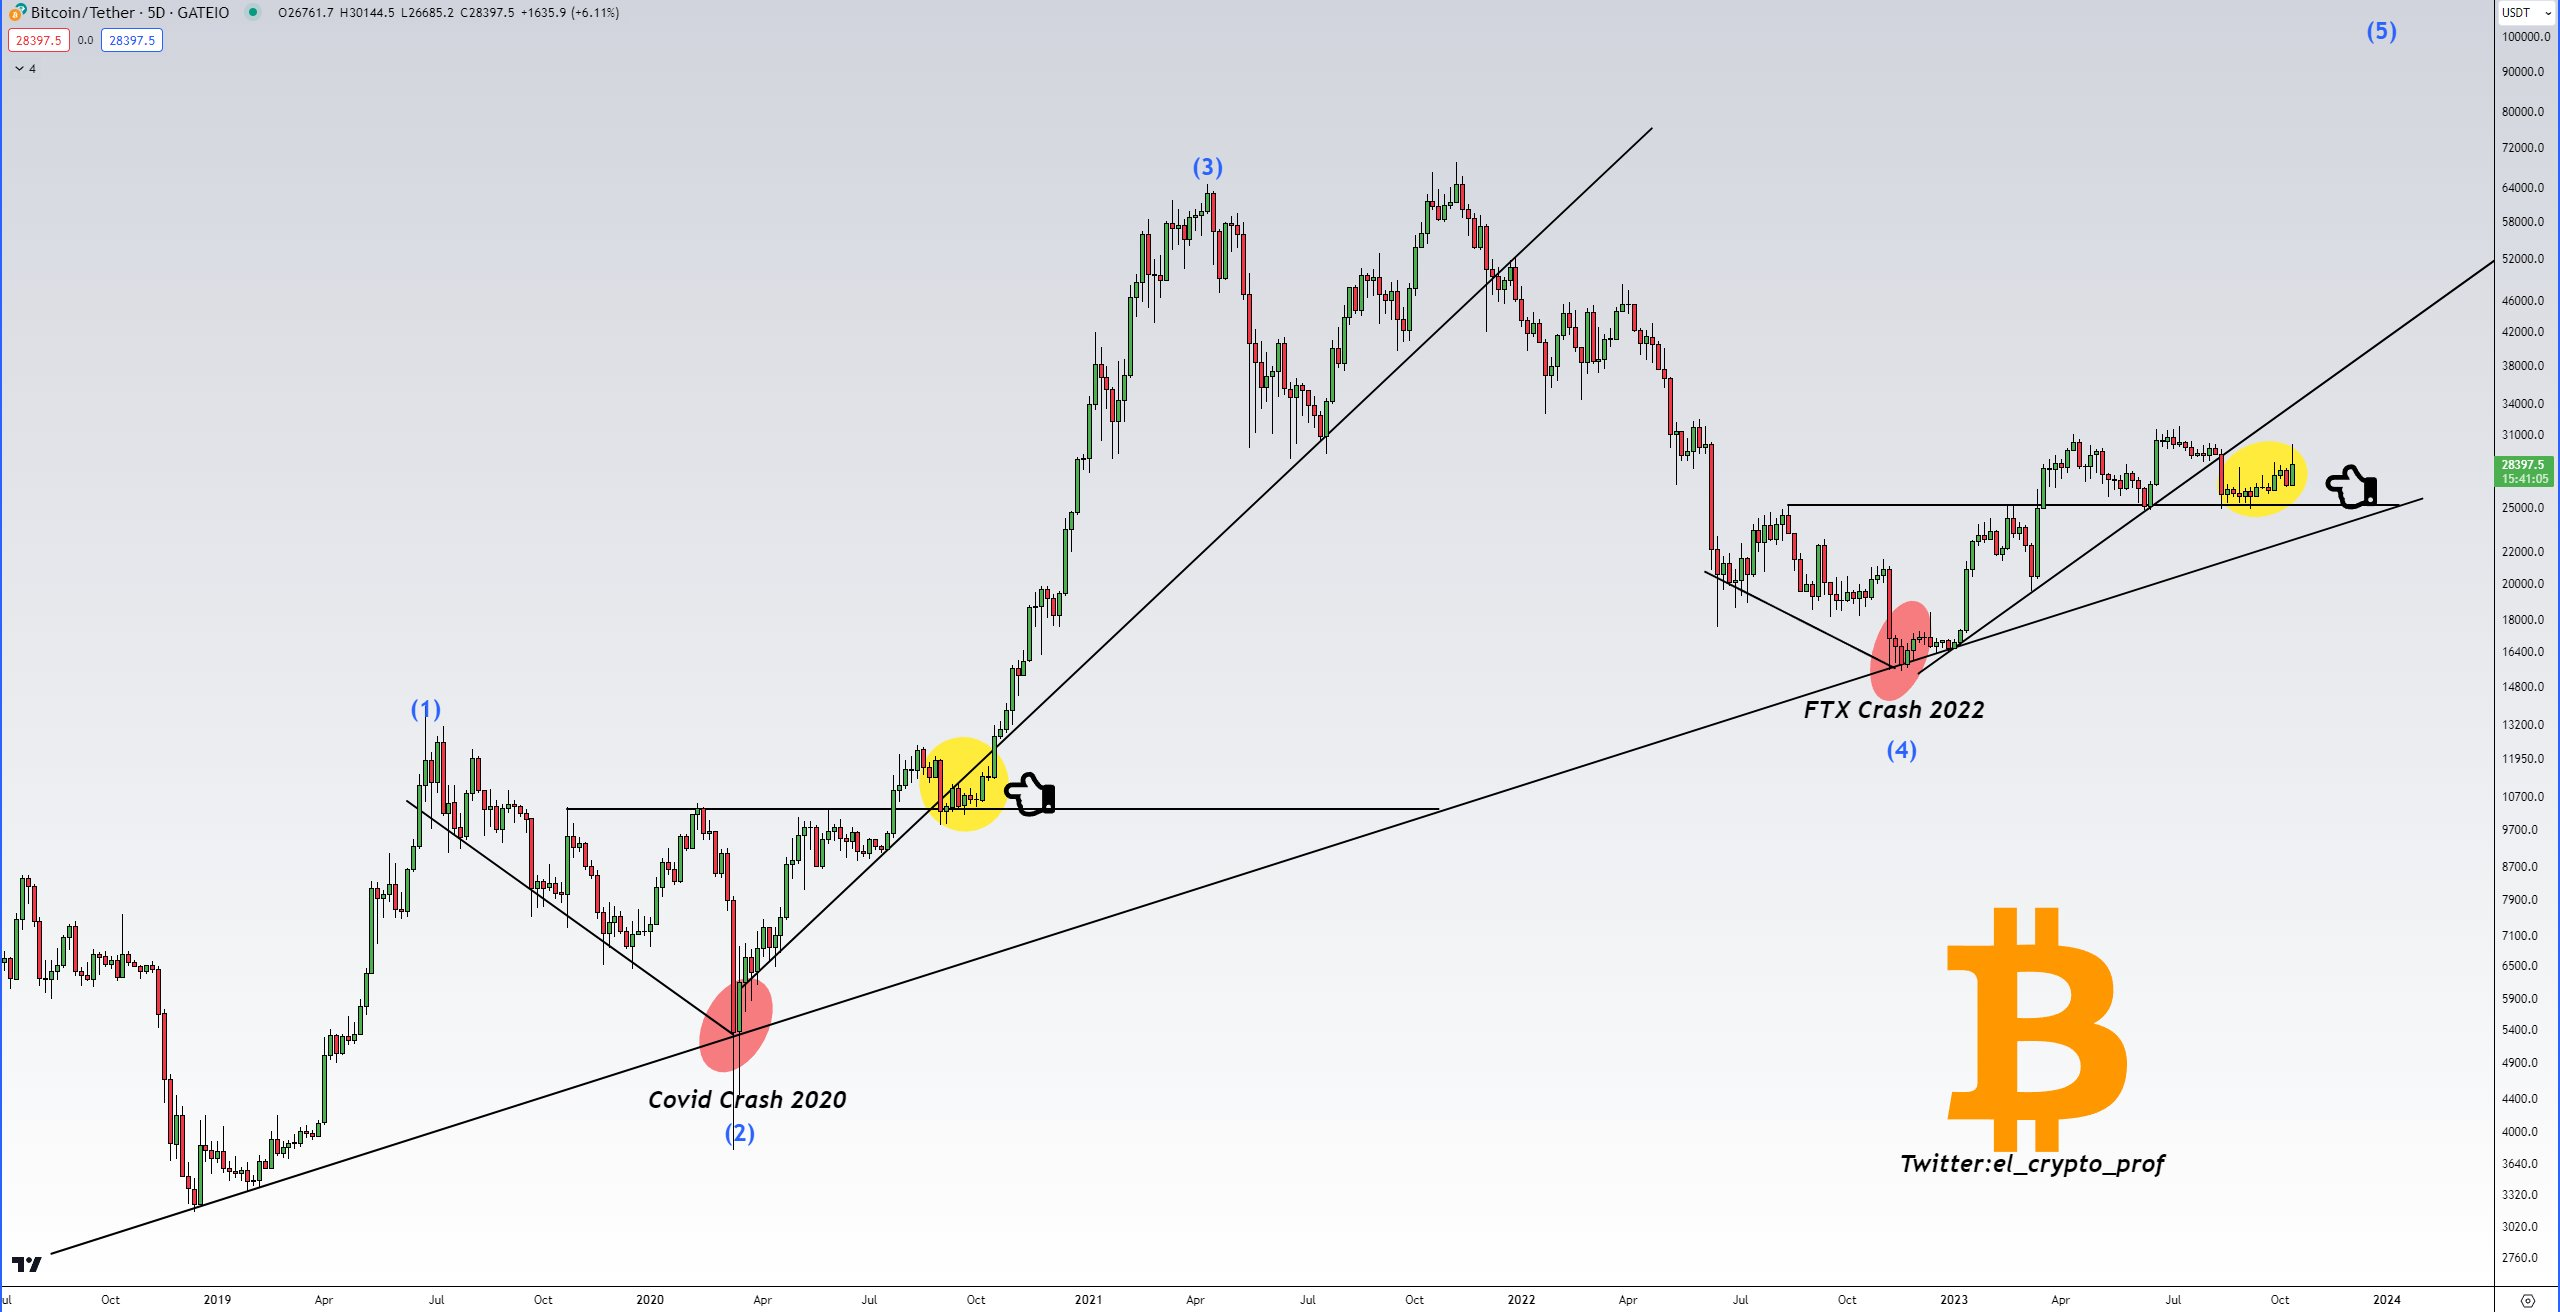 BTC/USD annotated chart. Source: Moustache/X
Read more: Crypto Dominance: UK & Beyond

Trending


Press Releases

Deep Dives


