October Market Insights: US Legislation and Crypto Trends

On September 30, lawmakers in the United States, both in the House and Senate, reached a temporary consensus, averting a government shutdown for a period of 45 days. This development had the potential to serve as a catalyst for Bitcoin's BTC price, causing it to surge to $27,605 on October 1. Furthermore, the historically robust performance of Bitcoin in October could have further boosted investor sentiment.
October typically finds U.S. stock markets in a favorable position. Data from the Stock Trader’s Almanac reveals that between 1950 and 2021, the S&P 500 Index (SPX) has witnessed an average increase of 0.9% in October. Nevertheless, it is important to note that this historical trend does not imply unwavering optimism, as the stock market experienced a severe downturn during the Black Monday crash in October 1987.
 Daily cryptocurrency market performance. Source: Coin360
While a short-term upward movement in the cryptocurrency markets remains plausible, it is improbable that it would trigger an uncontrolled rally. Higher price levels are likely to attract profit-taking, given the substantial ascent of the U.S. dollar index (DXY), which could keep bullish investors cautious.
Let's now delve into the crucial overhead resistance levels in Bitcoin and alternative cryptocurrencies that may draw in sellers. We will analyze the charts to gather more insights.
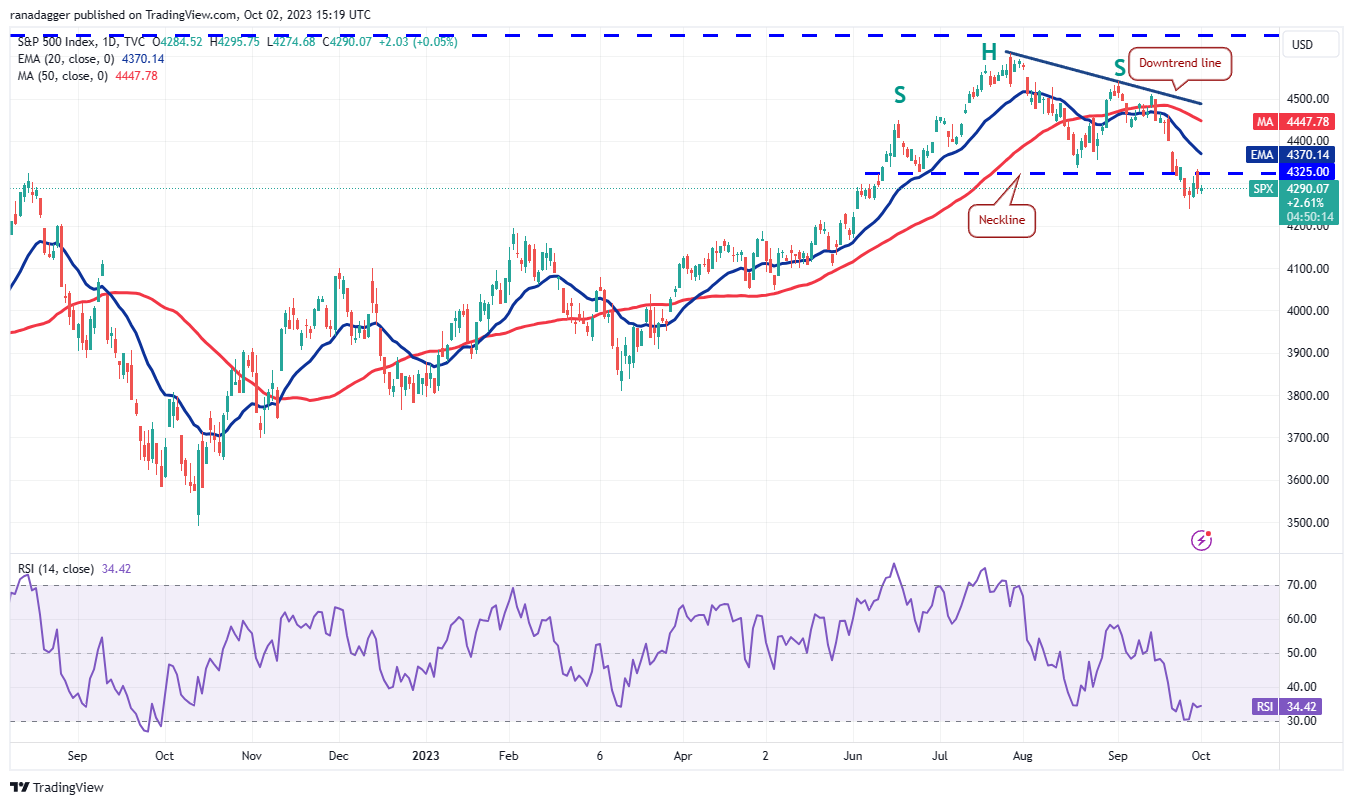
S&P 500 Index Price Analysis
On September 22, the S&P 500 Index witnessed a significant drop below the formidable support at 4,325, completing a bearish head and shoulders pattern and signaling the beginning of a downward trend.
 SPX daily chart. Source: TradingView
Typically, after such a pattern, prices tend to retest the breakdown level, which, in this case, is 4,325, as occurred on September 29. The neckline of this pattern is expected to be the battleground where bulls and bears vie for control.
A further drop below 4,238 would indicate bearish dominance, potentially accelerating selling and driving the index toward the pattern target of 4,043. Any attempt at recovery is likely to face resistance at 4,325 and subsequently at the 20-day exponential moving average ($4,370). A breakthrough above this resistance level would signal initial strength, potentially paving the way for further ascent, possibly towards the downtrend line.
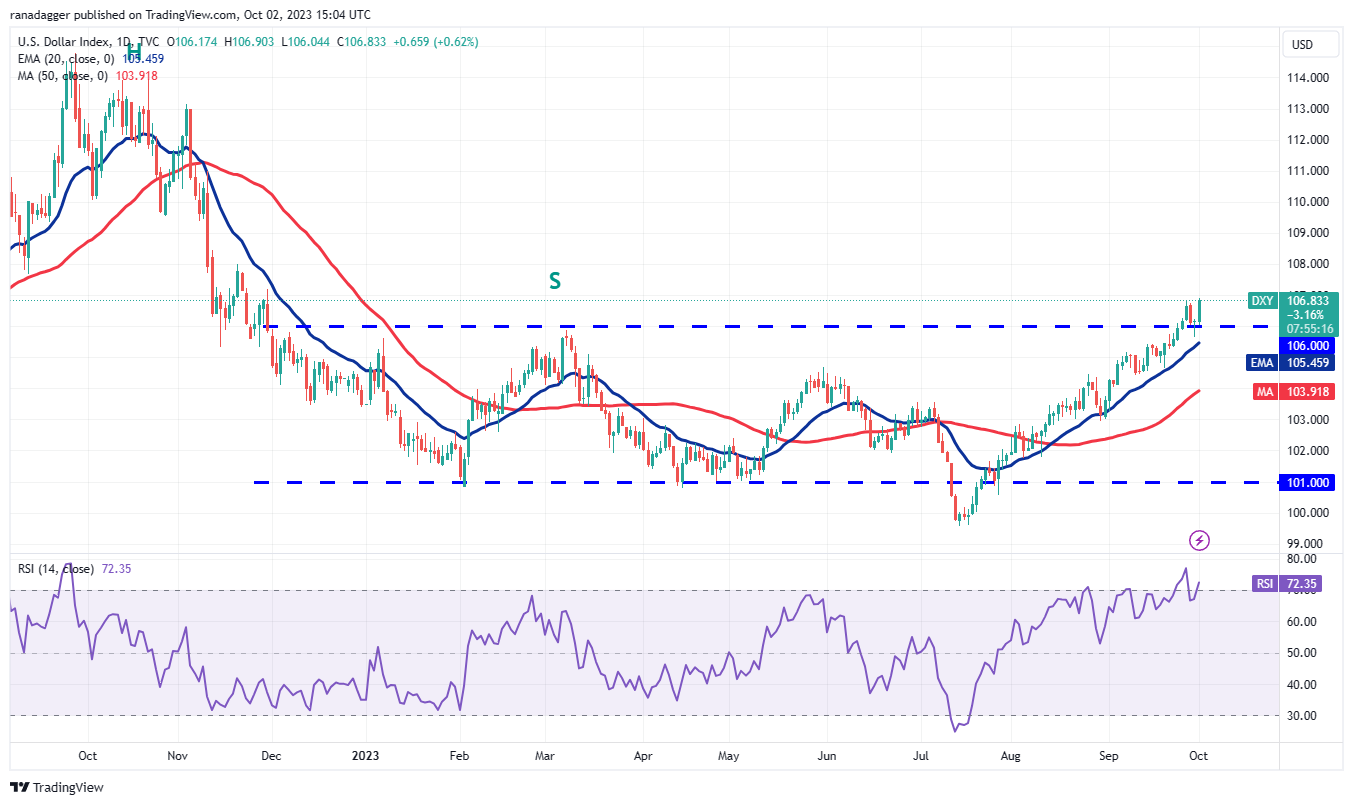
U.S. Dollar Index Price Analysis
The U.S. dollar index has displayed a remarkable upward trajectory in recent days, with bulls successfully propelling the price above the key resistance level of 106 on September 26, marking the start of a new uptrend.
 DXY daily chart. Source: TradingView
Although sellers attempted to pull the price back below the 106 level on September 29, strong buying at lower levels is evident from the long tail on the candlestick. Bulls will aim to establish 106 as a support level, potentially fueling a rally towards 108.
However, bearish resistance is likely to persist, as bears will strive to push the price below 106 and the 20-day EMA, possibly trapping overeager bulls. In such a scenario, the index could decline to the 50-day simple moving average ($103).
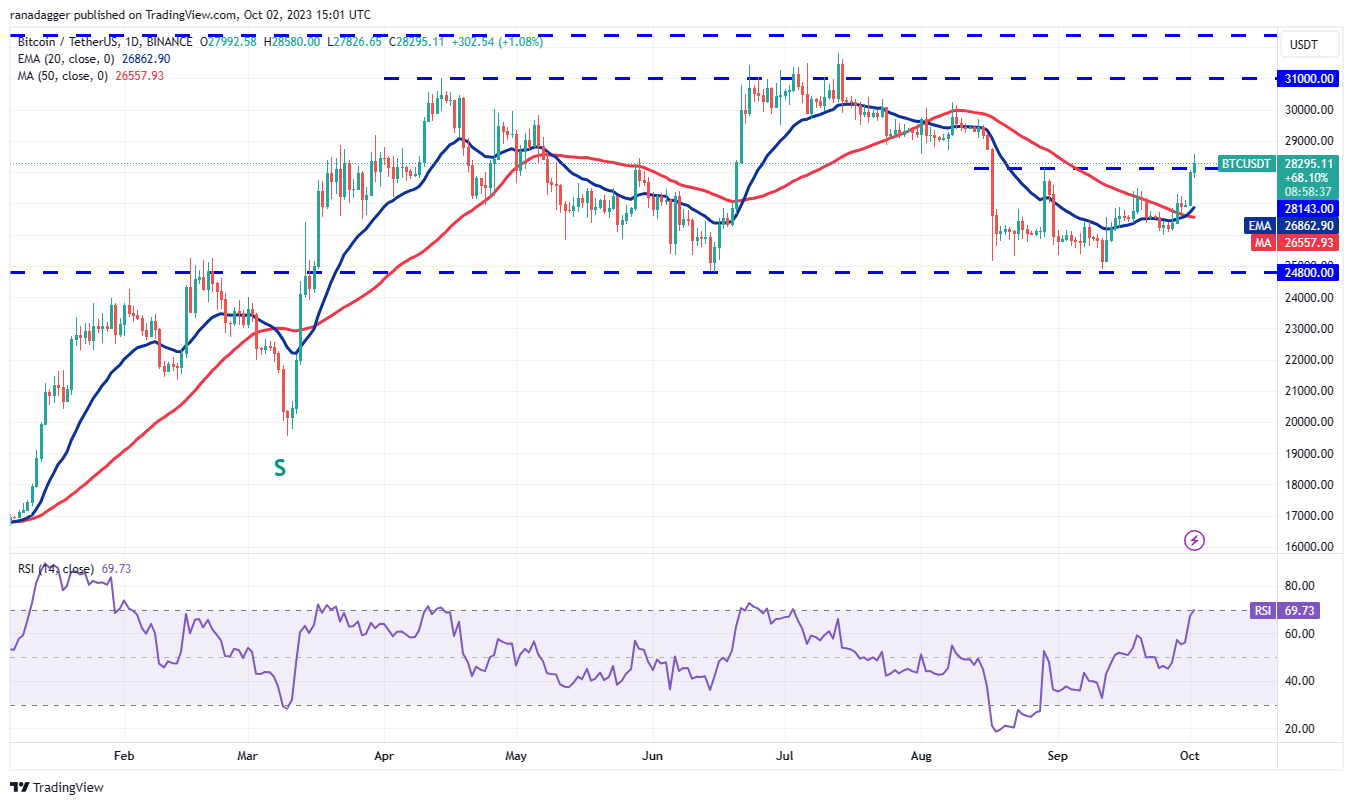
Bitcoin Price Analysis
Bitcoin surged above the immediate resistance of $27,500 on October 1 and continued its rally above $28,143 on October 2. The ease with which it conquered the $28,143 level suggests potential for further gains.
 BTC/USDT daily chart. Source: TradingView
Bulls will likely aim to push the price towards $31,000, but they are expected to face solid resistance from bears at this level. A sharp decline from $31,000 would indicate that the BTC/USDT pair remains within the broader range of $31,000 to $24,800. The first support level on the downside is $28,143, followed by the 20-day EMA ($26,862). A drop below $28,143 could trap aggressive bulls, potentially pulling the price to the 20-day EMA. Sellers would need to push the price below this level to assert control.
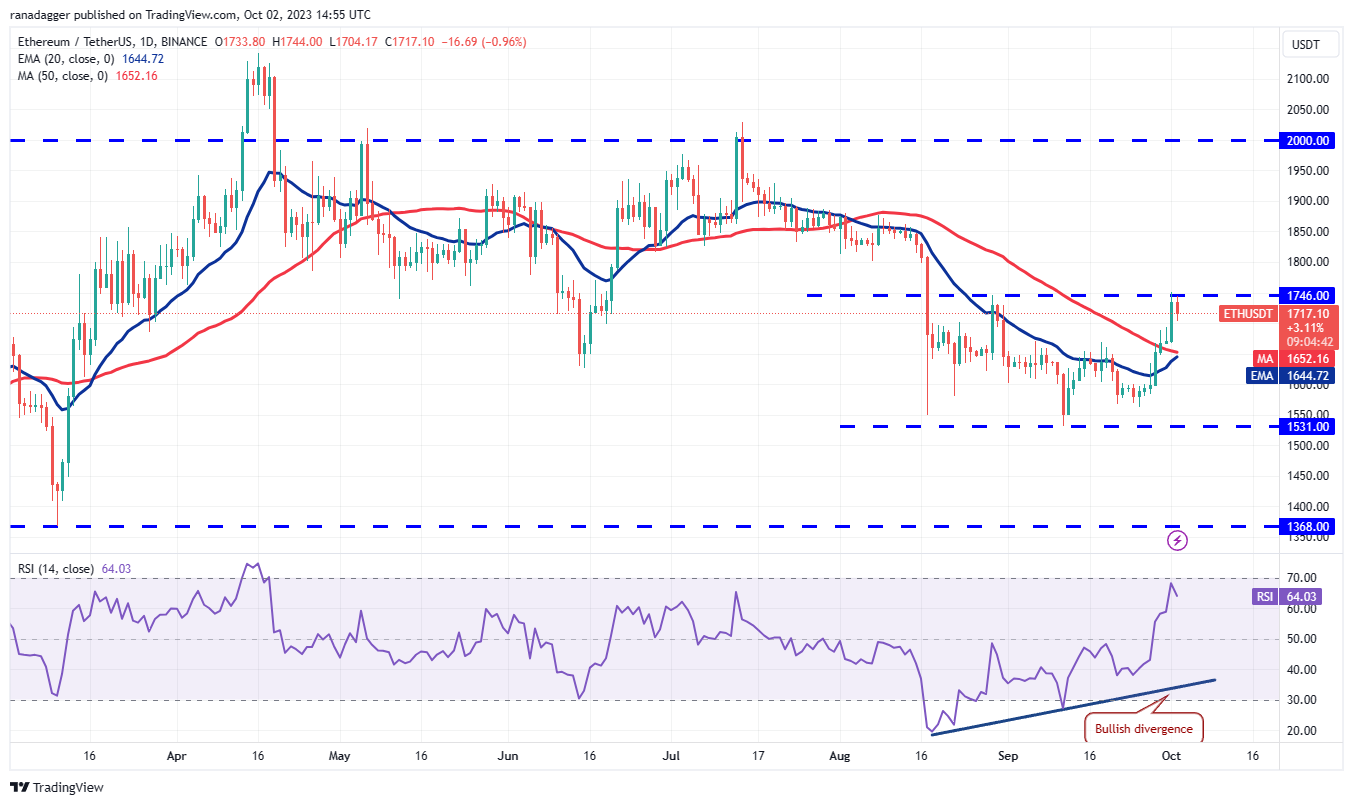
Ether Price Analysis
On September 29, Ether pierced the 50-day SMA ($1,652) and followed up with a strong rally on October 1, reaching the overhead resistance at $1,746.
 ETH/USDT daily chart. Source: TradingView
The 20-day EMA ($1,644) has turned upwards, and the RSI indicates bullish strength with a reading above 64, enhancing the likelihood of a rally beyond $1,746. If this occurs, the ETH/USDT pair would complete a double bottom pattern, with a target objective of $1,959.
Sellers will make efforts to halt the rally at $1,746, aiming to push the price below the moving averages and weaken the positive momentum. This could lead to an extended period of range-bound trading.
BNB Price Analysis
BNB turned down from the 50-day SMA ($216) on September 29 and 30 but found support at the 20-day EMA ($214). This suggests a positive sentiment where dips are being bought.
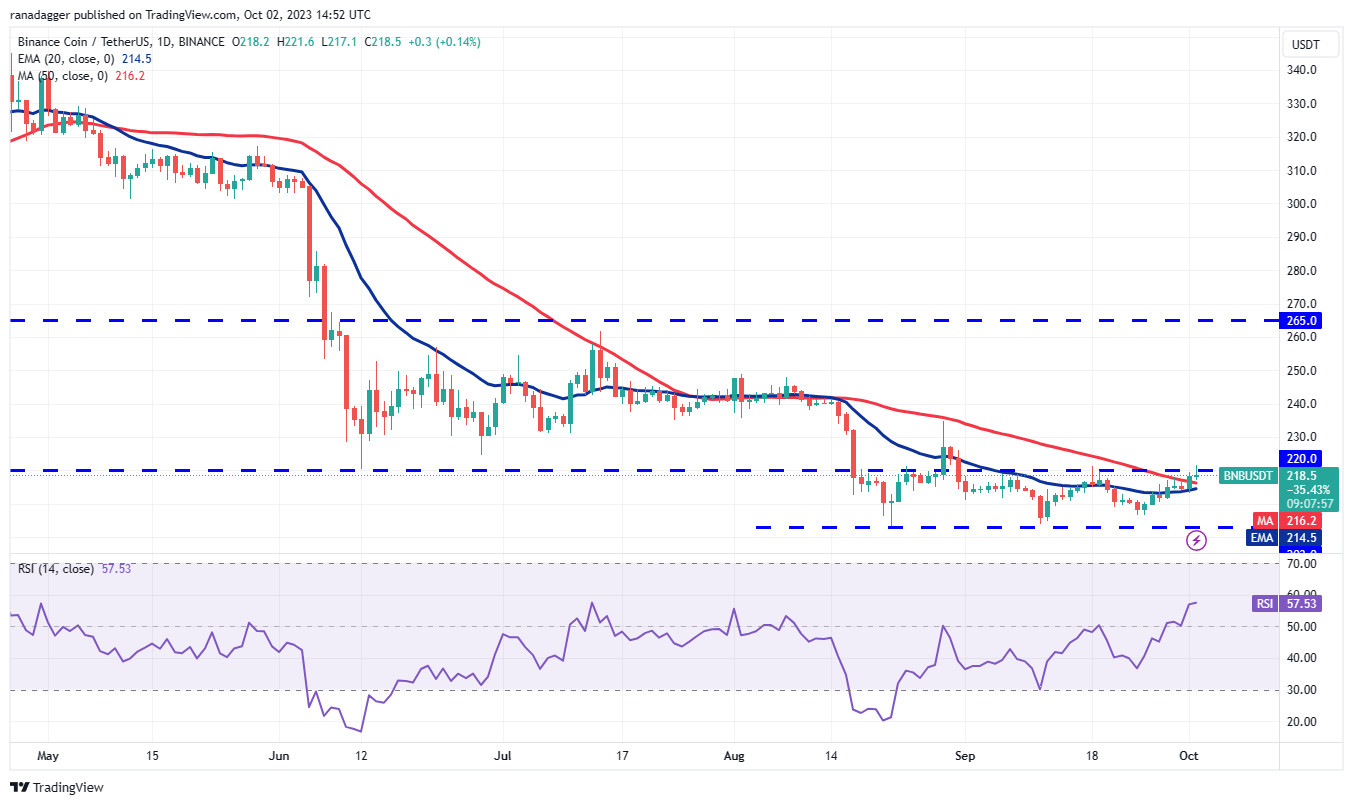 BNB/USDT daily chart. Source: TradingView
The moving averages are on the verge of a bullish crossover, and the RSI is in positive territory, indicating that bulls have the upper hand. A break and close above $220 would signify the start of a new uptrend, with potential rallies towards $235 and $250.
Conversely, if the price reverses from $220, bears will likely attempt to push the pair below the 20-day EMA, extending the consolidation phase.
XRP Price Analysis
XRP broke above a symmetrical triangle pattern on September 29, with bulls successfully holding the retest of the breakout level on September 30. This suggests a resurgence of bullish activity.
 XRP/USDT daily chart. Source: TradingView
Buyers will aim to push the price towards the overhead resistance at $0.56, which is a significant level to watch for a potential uptrend signaling the pattern target of $0.64.
However, if the price declines from $0.56, it would indicate ongoing bearish sentiment and selling pressure during rallies, possibly keeping the XRP/USDT pair within the range of $0.41 to $0.56.
Solana Price Analysis
Solana surged above the $22.30 resistance level on October 1, indicating a bullish comeback.
 SOL/USDT daily chart. Source: TradingView
The RSI is now in the overbought region, suggesting that the rally could encounter resistance soon. Bears may try to halt the recovery at $25.50 and then at $27.12. A reversal from these levels would affirm the range between $14 and $27.12.
The 20-day EMA ($20.50) is a critical support level, and sellers would need to breach it to weaken the bullish momentum.
Cardano Price Analysis
Cardano soared above the downtrend line and the 50-day SMA ($0.25) on October 1, invalidating the developing bearish descending triangle pattern.
 ADA/USDT daily chart. Source: TradingView
While this is generally a positive sign, there could be a retracement to retest the breakout level. If the level holds, it would signify that the bulls have turned the downtrend line into support, potentially leading to an upward move towards $0.29 and then $0.32.
Conversely, if the price reverses and re-enters the triangle, it would suggest a rejection of higher levels, with the pair possibly retesting the crucial support at $0.24.
Dogecoin Price Analysis
Dogecoin rose above the 20-day EMA ($0.06) on September 29 and reached the 50-day SMA ($0.06) on October 1. This indicates that bulls are attempting an upward move. The 20-day EMA is relatively flat,
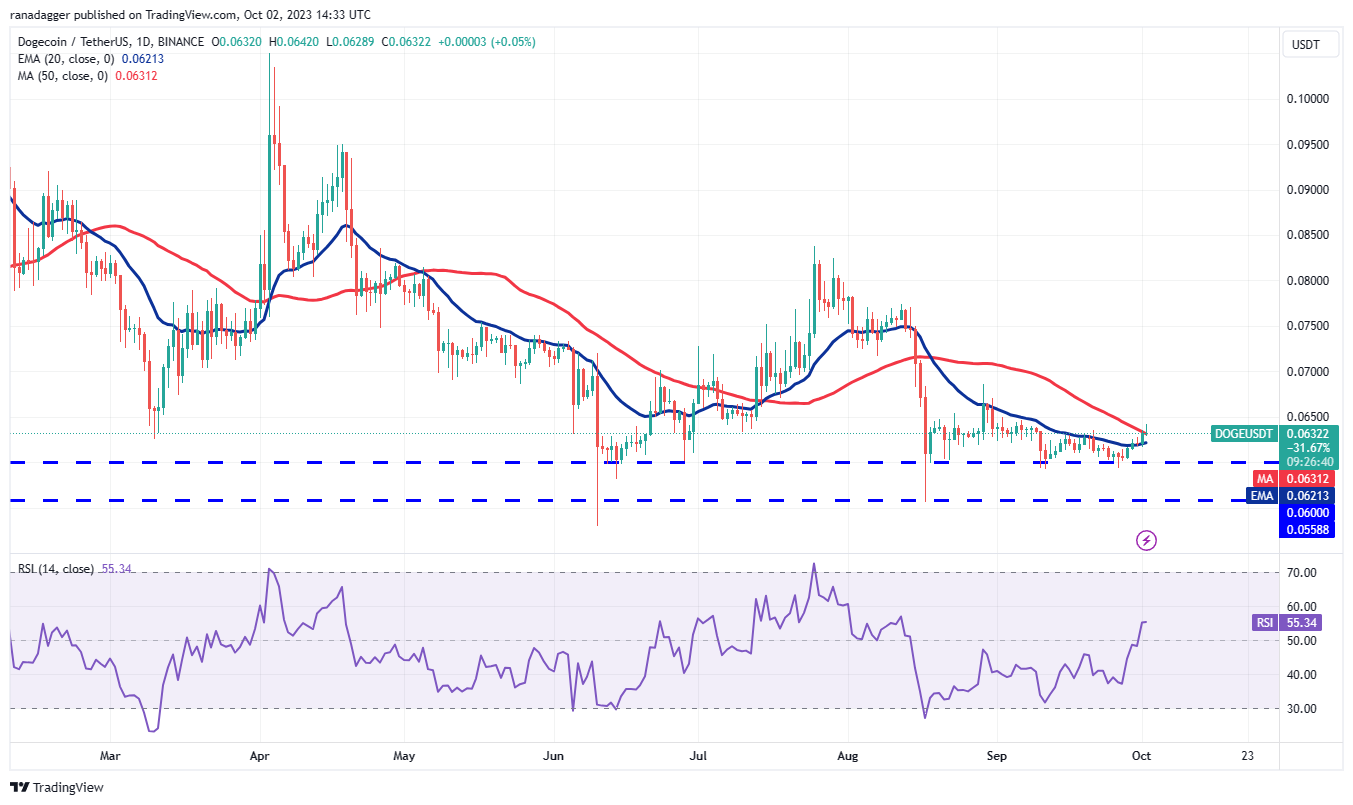 DOGE/USDT daily chart. Source: TradingView
but the RSI is in the positive zone, suggesting a shift in momentum. A close above the 50-day SMA could pave the way for a possible rally to $0.07, with $0.07 acting as a minor hurdle. If crossed, the DOGE/USDT pair could climb to $0.08.
To deter the rally, bears need to swiftly push the price back below the 20-day EMA. In such a scenario, the pair may retest the critical support at $0.06.
Toncoin Price Analysis
Toncoin's (TON) relief rally stalled at $2.31 on September 28, indicating that bears are selling at higher levels. The price turned down but found support at $2.07 on October 1.
 TON/USDT daily chart. Source: TradingView
However, bears renewed their selling on October 2, pushing the price below the crucial support at $2.07. If the price remains below this level, selling pressure could intensify, and the TON/USDT pair may fall to the 50-day SMA ($1.84).
To initiate a potential uptrend, bulls need to drive the price above $2.31, possibly prompting a retest of the overhead resistance at $2.59. However, this level may attract aggressive selling from bears.
Read more: Cryptocurrency Market Analysis: October 2023 Overview

Trending


Press Releases

Deep Dives


