- Home
- Cryptocurrency
- Digital Currency Chronicles: Price Surges, Market Insights, and Network Dynamics
Digital Currency Chronicles: Price Surges, Market Insights, and Network Dynamics

Bitcoin has experienced a recent upsurge, breaking through the significant $30K resistance level after a solid rebound from the support zone situated at $25K. Nevertheless, market observers anticipate an impending short-term correction, and it's crucial to navigate these waves with a discerning eye.
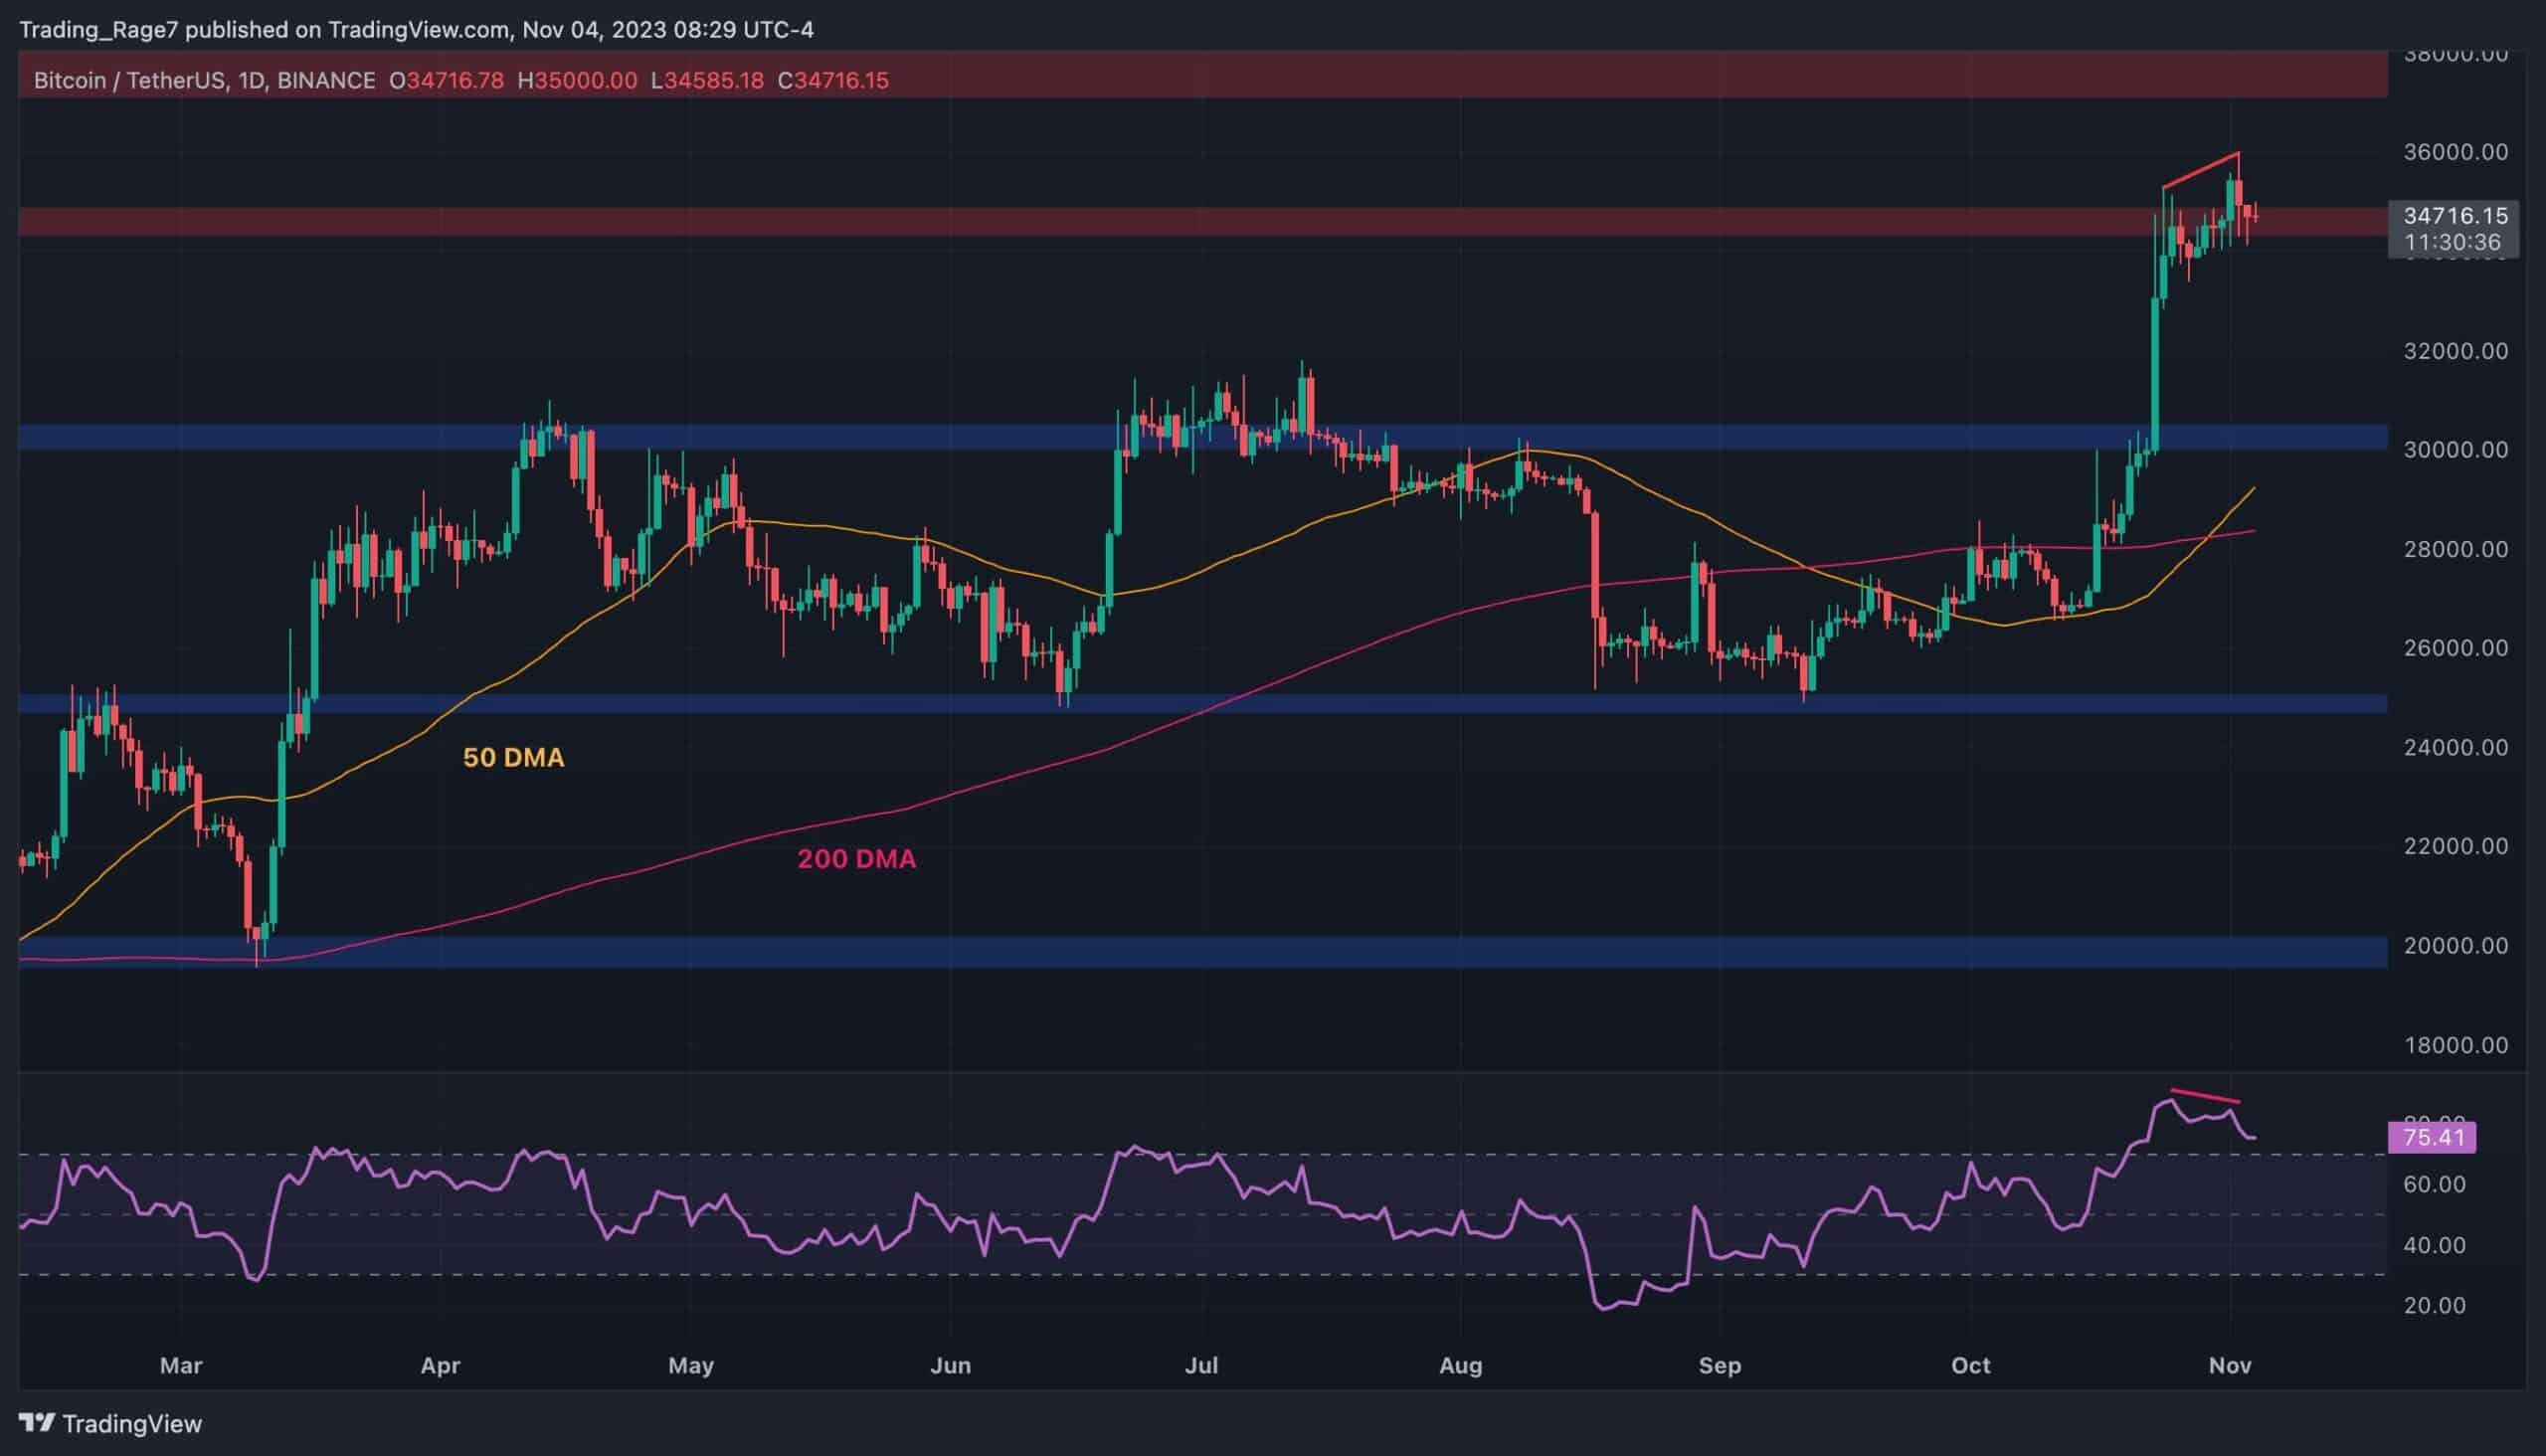
The Daily Chart
Upon closer examination of the daily chart, we can observe that the price has not only conquered the $30K resistance but has embarked on an impressive rally, making its way toward the $35K threshold. However, the price currently finds itself in a consolidation phase at this juncture, suggesting a potential correction on the horizon. Compounding this viewpoint, the Relative Strength Index (RSI) has ventured deep into the overbought territory and exhibits a clear bearish divergence between the last two price peaks, further bolstering the likelihood of a retracement from the $35K zone.
 Source: TradingView
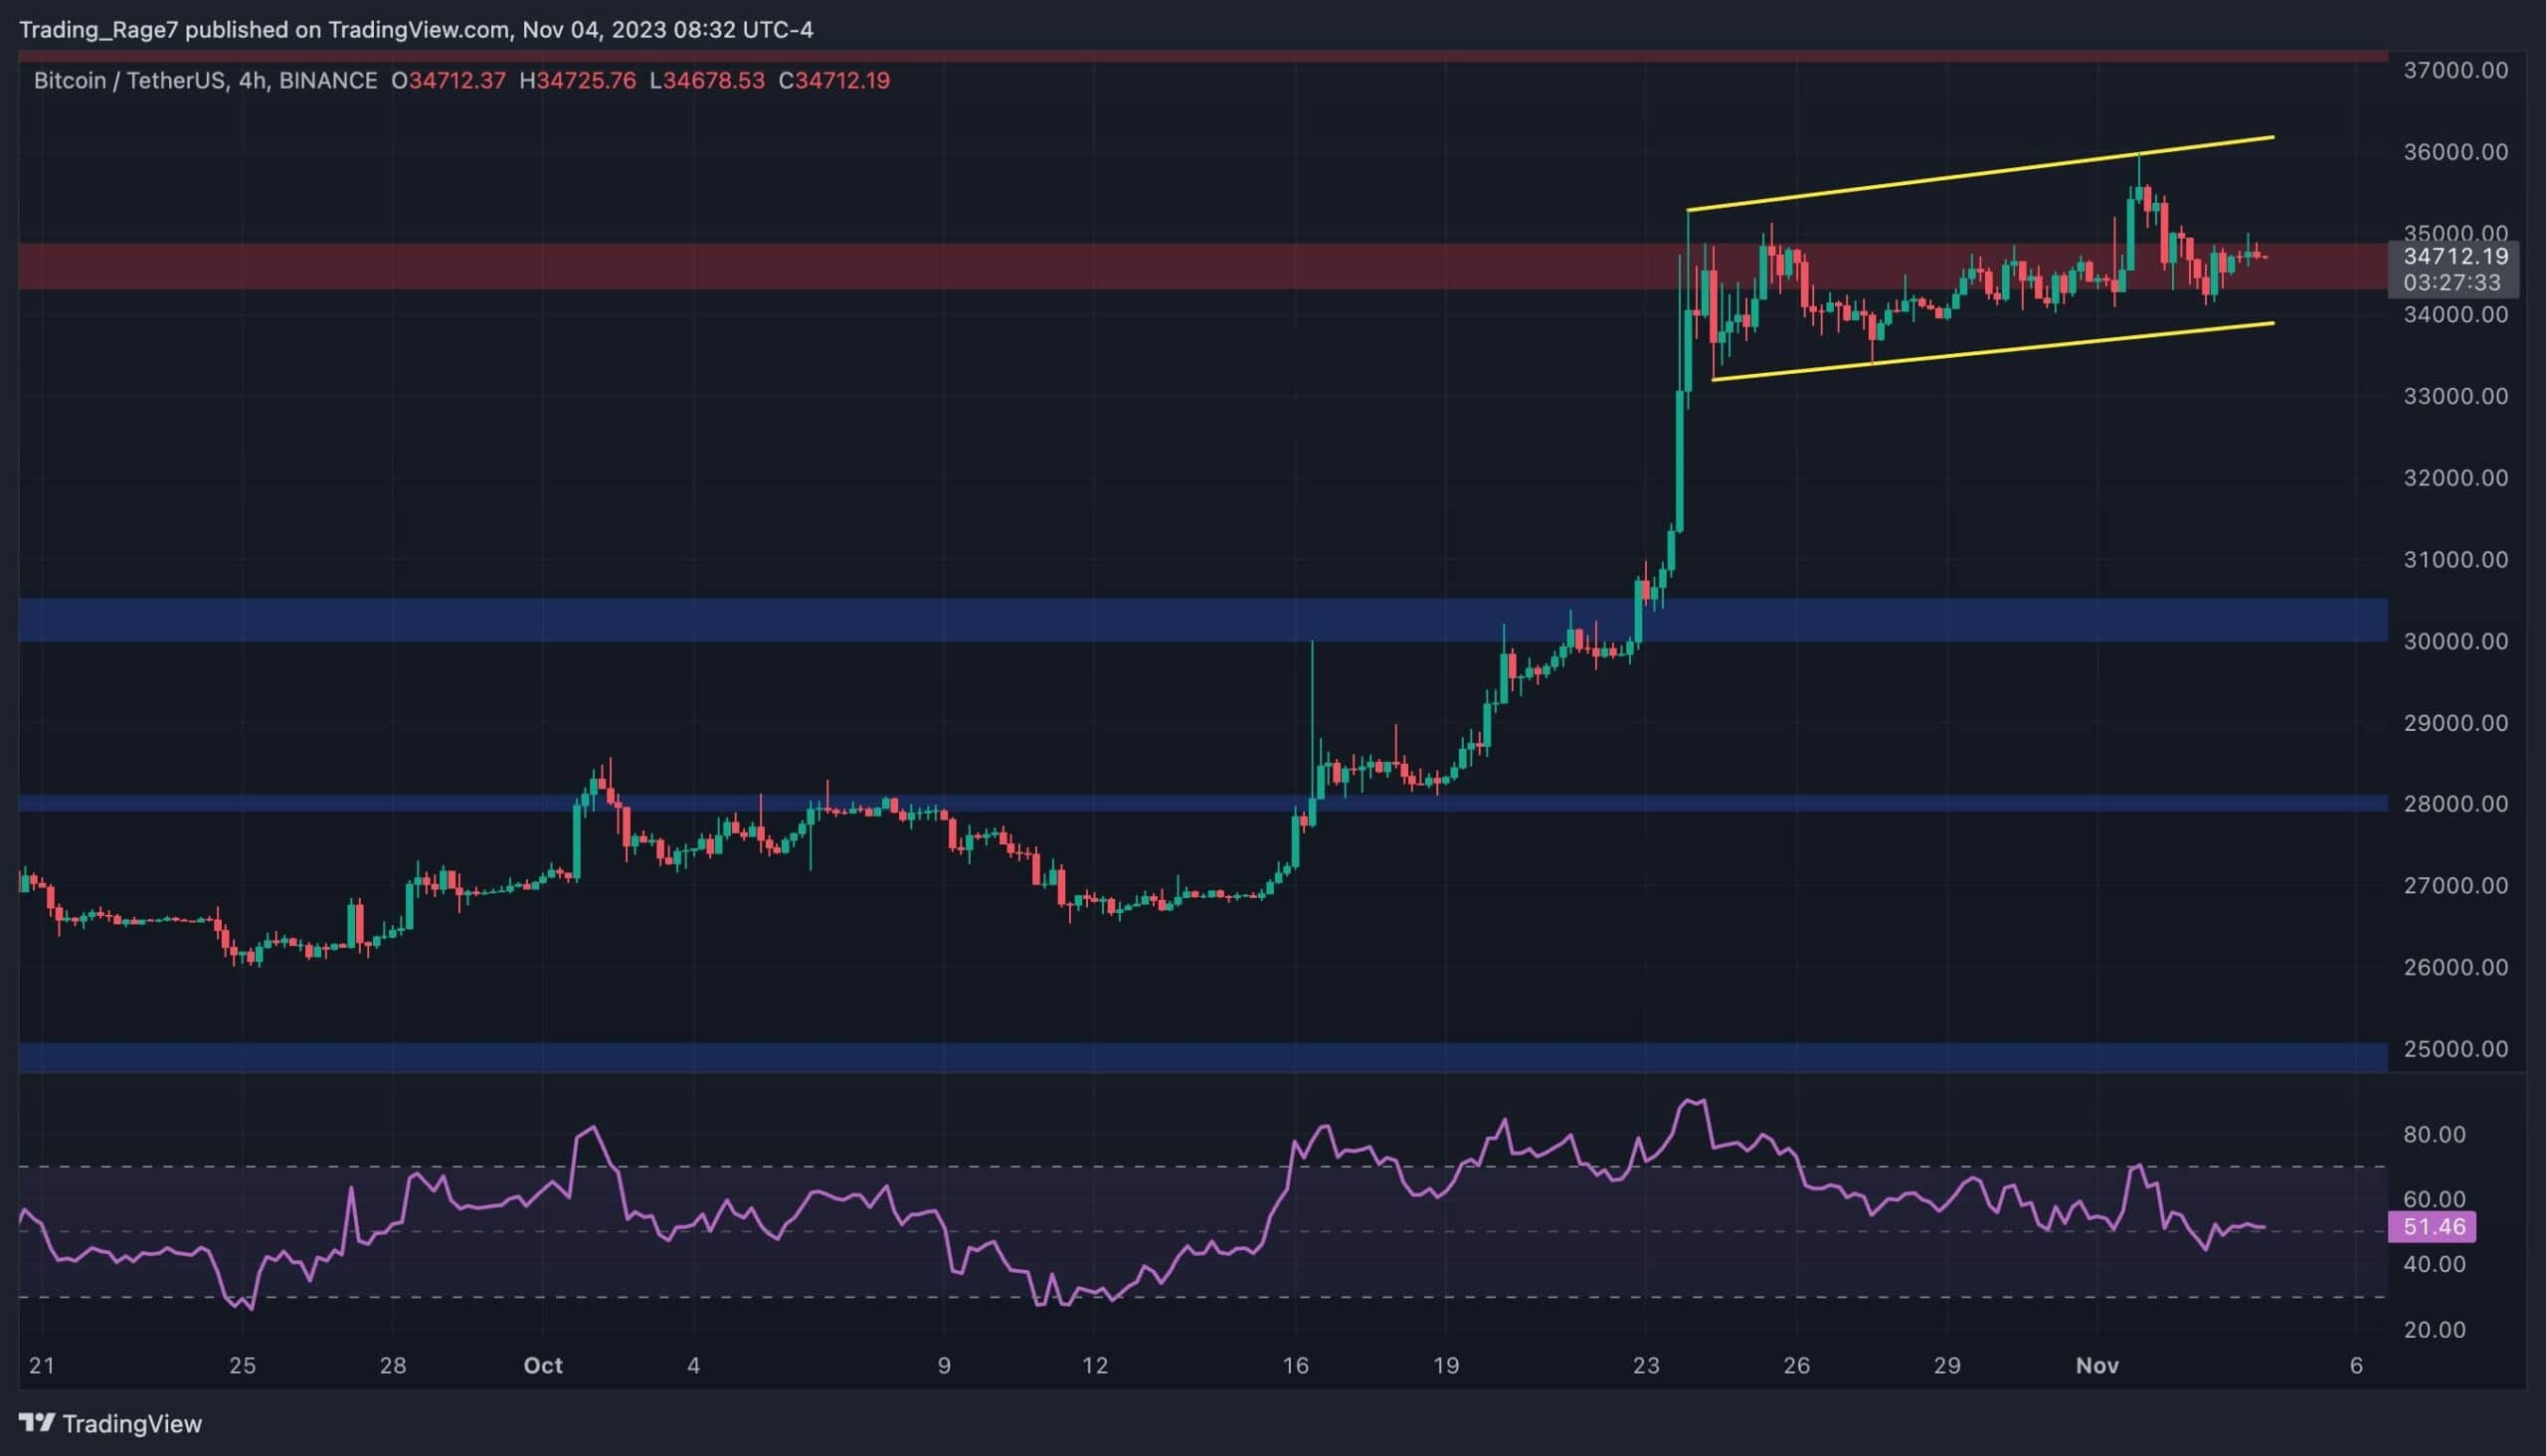
The 4-Hour Chart
Zooming in on the 4-hour timeframe reveals a more intricate picture. The market has been carving out an ascending channel centered around the $35K mark, a pattern that may foreshadow a bearish reversal if the price breaches the lower boundary. On the flip side, a bullish breakout from this pattern could ignite a more substantial rally aimed at challenging the resistance level at $37K. It's noteworthy that, within this time frame, the RSI hovers around the 50% mark, indicating that the prevailing momentum has reached a state of equilibrium.
Therefore, the final outcome hinges on the direction in which the market chooses to break free from the confines of the aforementioned channel.
 Source: TradingView
Bitcoin Active Addresses
The recent surge in Bitcoin's price has drawn renewed attention to the cryptocurrency market, stirring speculation about the onset of a new bullish phase. Yet, prudent investors also entertain the possibility that the recent rally could be a deceptive bull trap. A thorough analysis of the fundamental metrics of the Bitcoin network can offer valuable insights in this uncertain climate, and one of the most influential network indicators is the number of active addresses.
Displayed in the following chart is the 30-day exponential moving average of Bitcoin's active addresses. These addresses signify the unique entities that have successfully transacted BTC on the network, serving as either senders or receivers.
It is worth noting that, since the inception of 2023, the count of active addresses has exhibited a gradual uptrend. This consistent growth has been a pivotal driving force behind the extended period of bullish price action witnessed over the past nine months. Consequently, a continued rise in this metric is likely to sustain the ongoing bullish momentum. Conversely, a drop in network activity could serve as an early indicator of a potential bearish reversal, adding an additional layer of complexity to the crypto market's ever-evolving narrative.
 Source: CryptoQuant
Read more: The Digital Frontier Chronicles: Navigating the Crypto Cosmos

Trending


Press Releases

Deep Dives


