- Home
- Cryptocurrency
- XRP Price Trends
XRP Price Trends

The USDT Paired Chart Overview
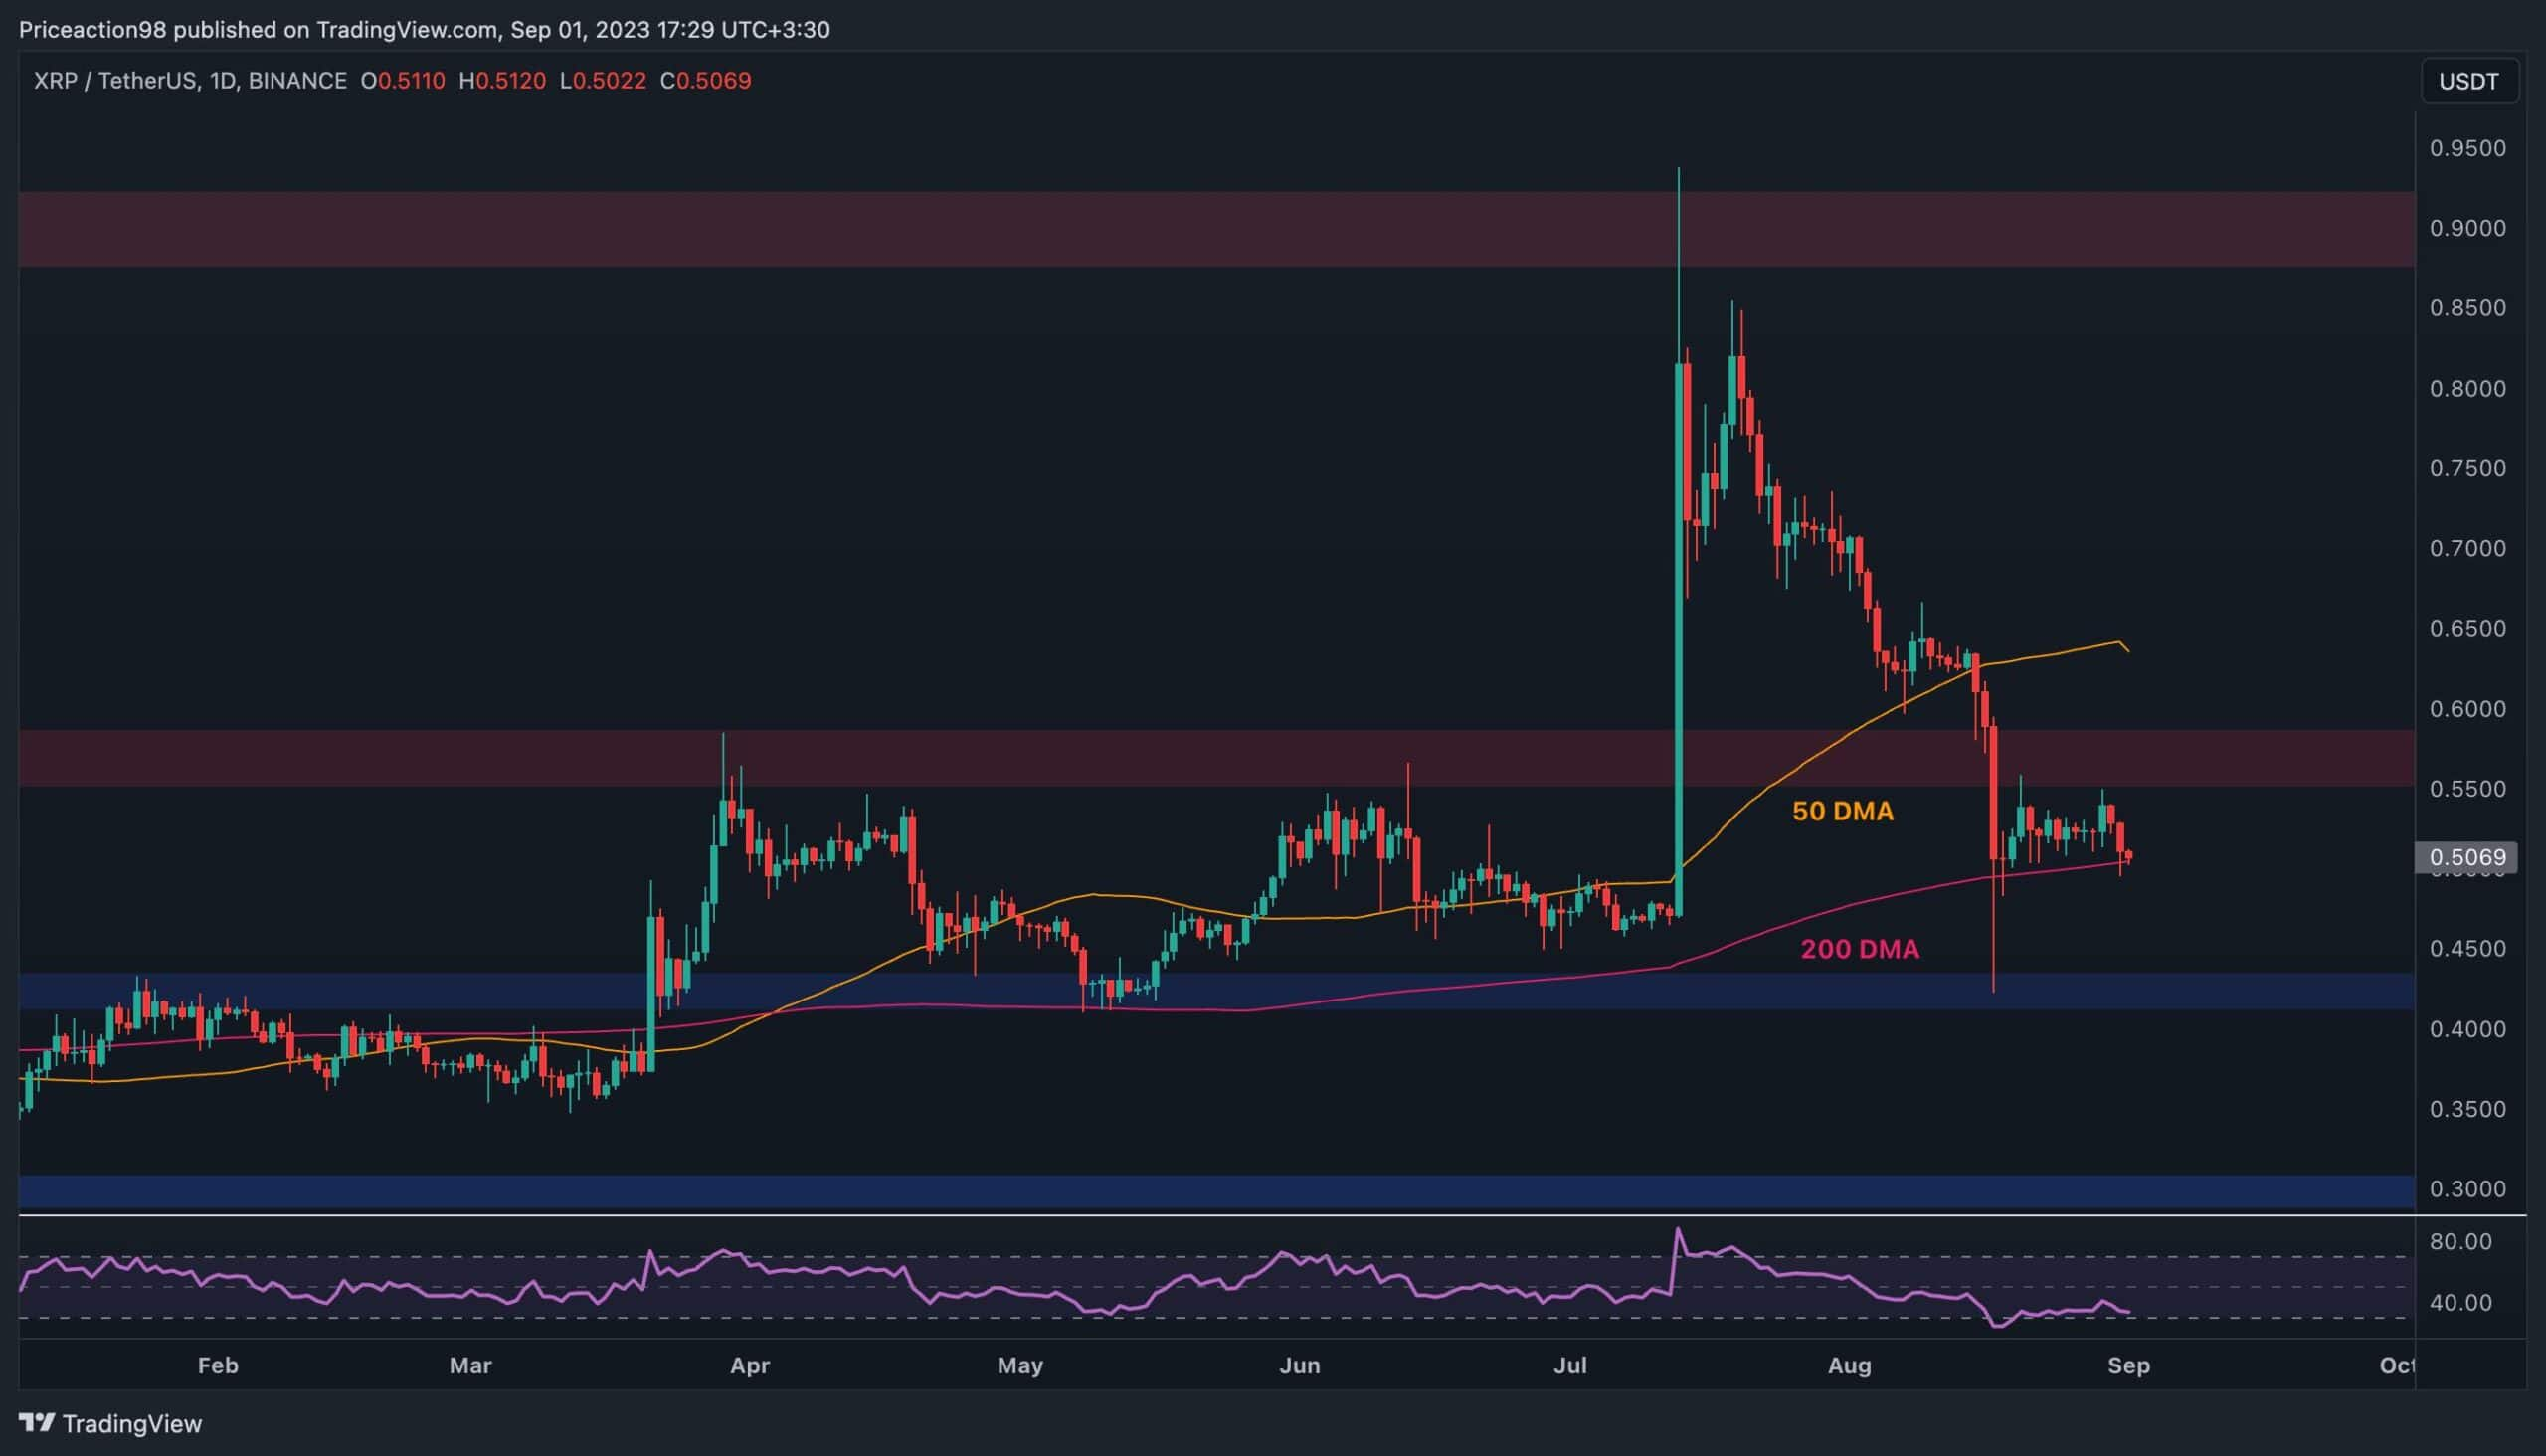
Taking a closer look at the USDT paired chart, we can discern a noteworthy trend that has persisted for the past few weeks. The price has displayed remarkable resilience, maintaining its position above the crucial 200-day moving average, which hovers around the $0.5 mark. However, at this juncture, the price is currently undergoing a rigorous test, challenging the stability of the aforementioned 200-day moving average. In the event of a breakdown in this moving average, we can expect a swift and decisive descent in the price, pushing it towards the $0.43 level.
On the flip side, should the price successfully rebound from the 200-day MA, it may pave the way for a bullish upswing, ultimately propelling it towards the formidable $0.55 resistance zone. Nonetheless, it's imperative to consider the RSI indicator's consistent readings below the 50% threshold, indicating a prevailing sentiment skewed towards the bearish side of the spectrum.

The BTC Paired Chart: A Detailed Analysis
Shifting our focus to the BTC paired chart, we observe a striking similarity in the pattern. XRP's trajectory has been predominantly downward, gradually approaching the critical 1800 SAT level. This decline follows the breach of the 2200 SAT level and the subsequent slip below the 50-day moving average, previously located in the vicinity of the 2100 SAT area. Optimistic XRP investors are now pinning their hopes on the 200-day moving average, positioned tantalizingly close to the 1800 SAT mark. They anticipate that this moving average will act as a stalwart guardian, preventing the price from descending further, particularly into the perilous territory of the 1500 SAT range and beyond. However, should XRP fail to hold the line at this crucial support zone, the outlook on the Bitcoin-paired chart is expected to darken considerably.


Trending


Press Releases

Deep Dives


