- Home
- Cryptocurrency
- XRP: Chart Chronicles
XRP: Chart Chronicles

XRP has been in a consolidation phase on the USDT pair for the past few weeks, exhibiting a lack of strong inclination towards either a decline or an uptrend. However, the scenario takes a distinct turn when observed against BTC.
Examining Ripple's Price Trends on the USDT Chart
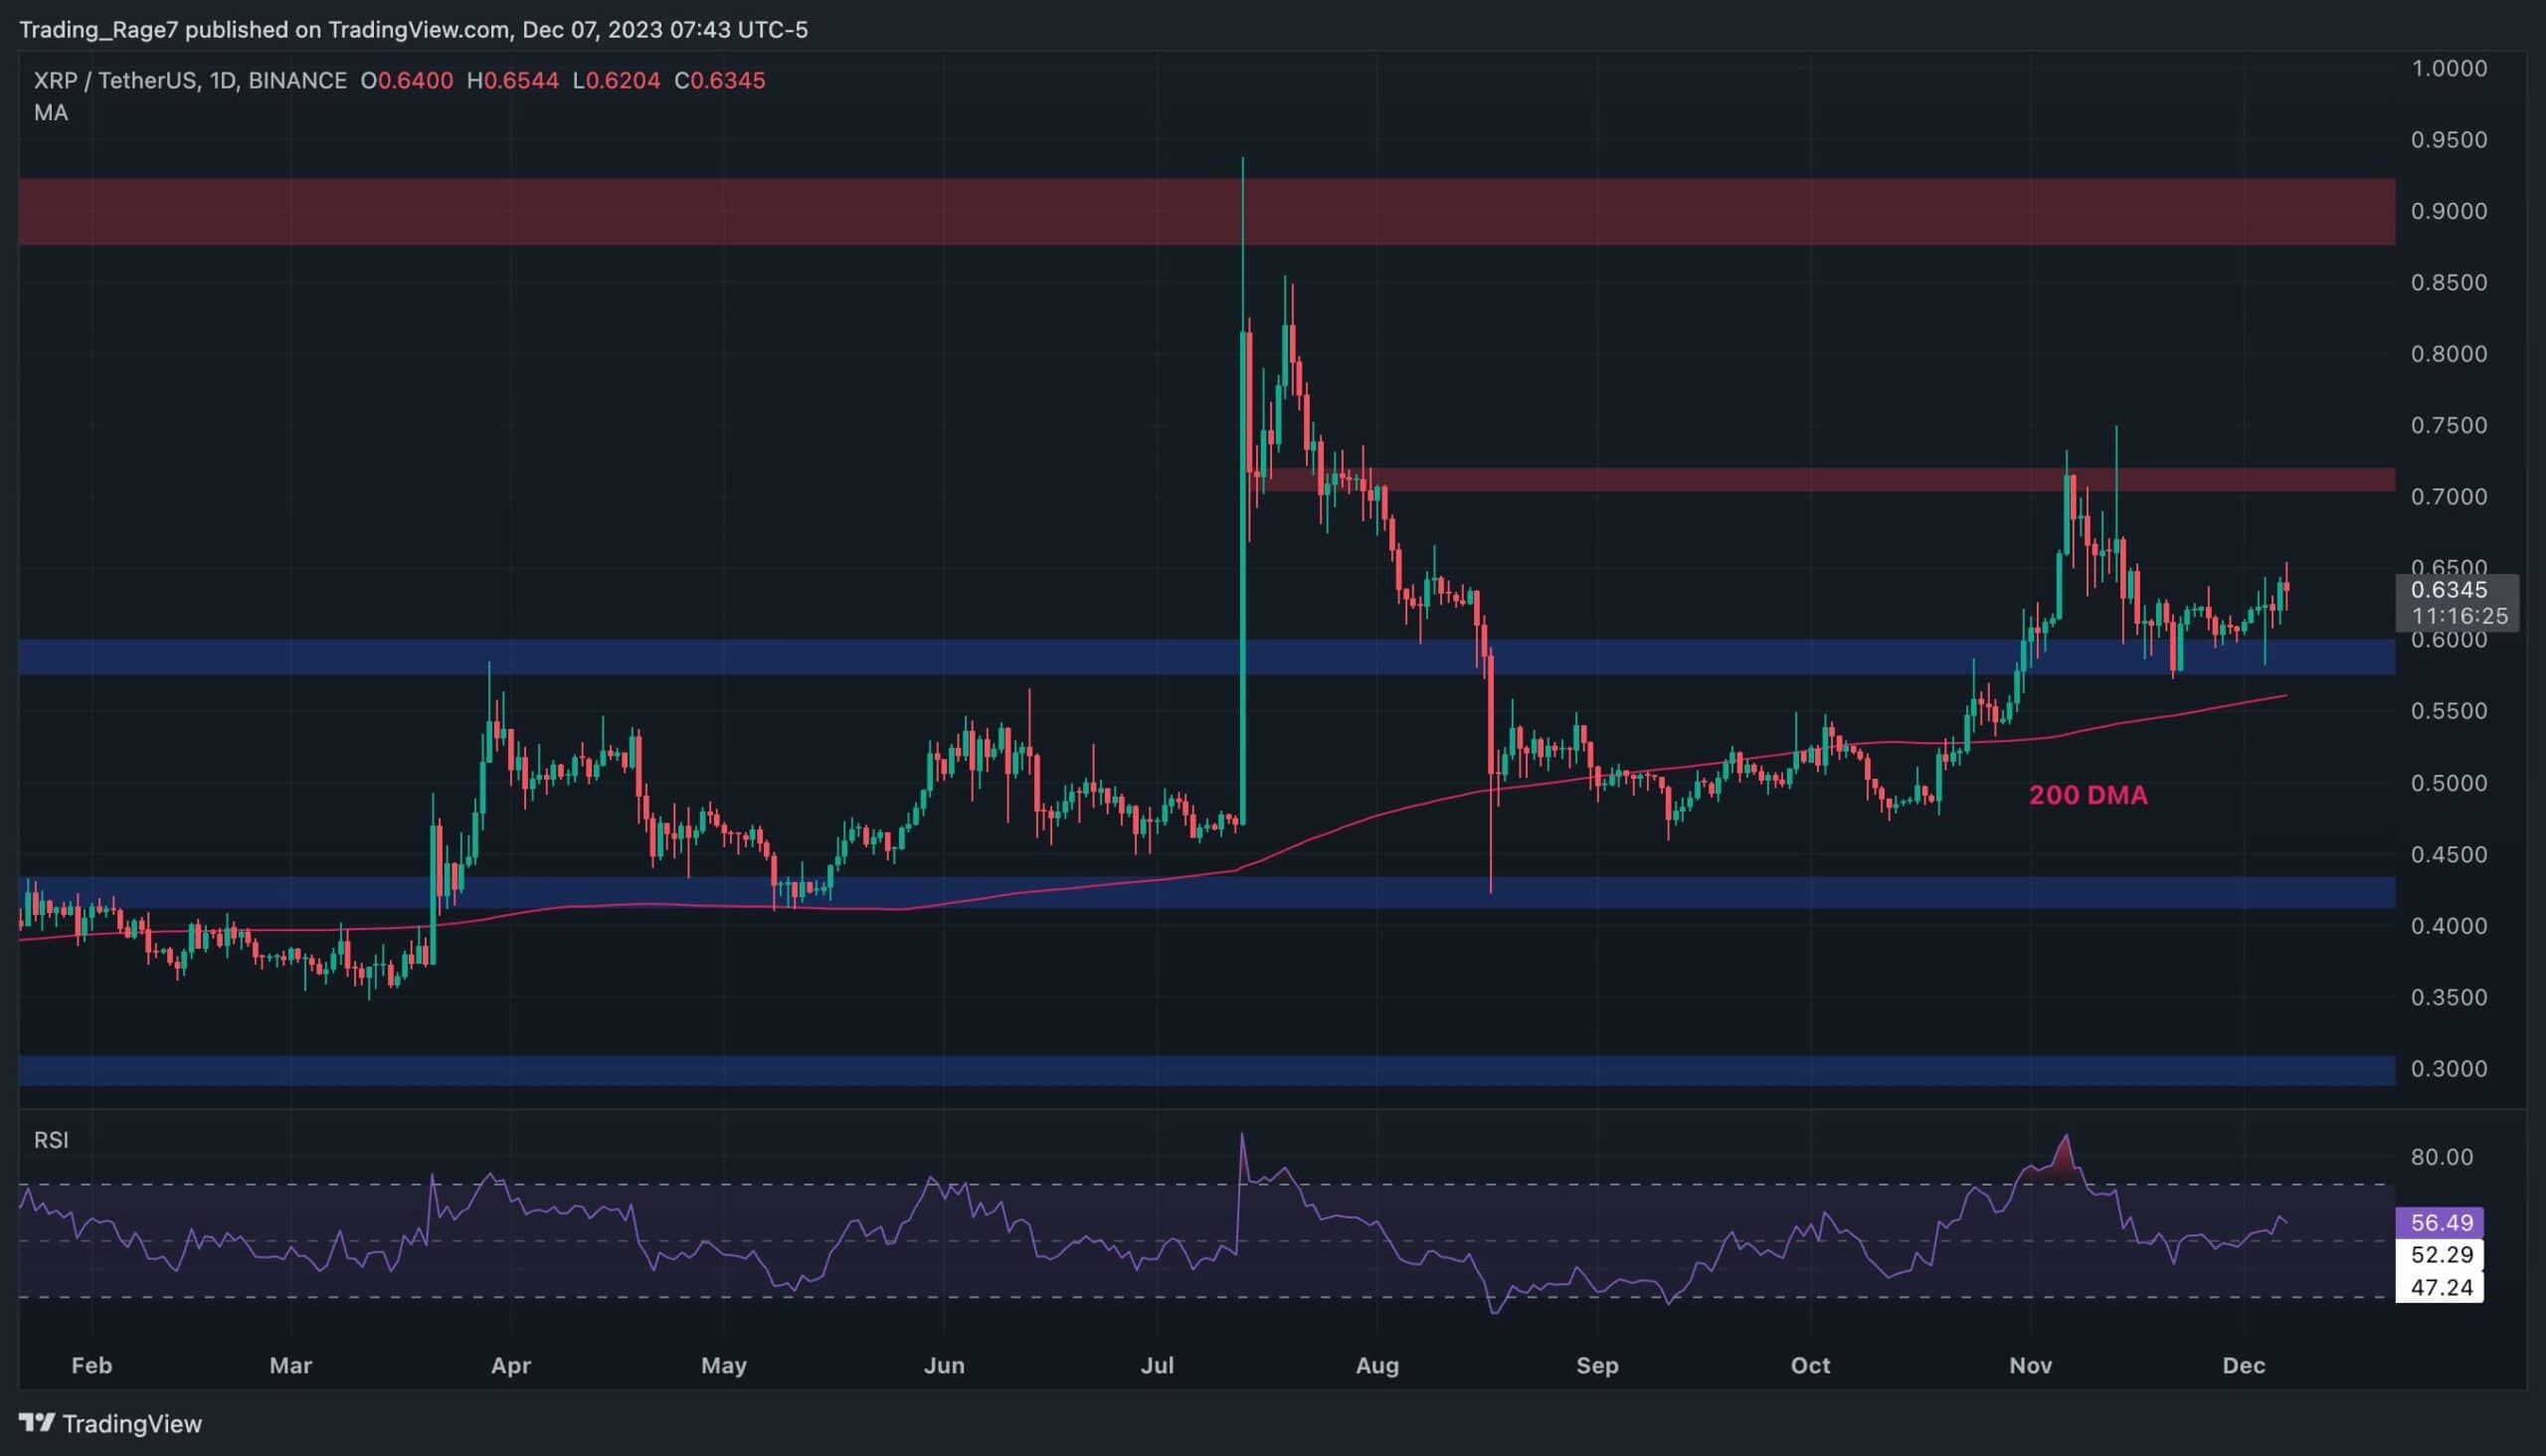
On the USDT chart, the price has found support around the $0.6 mark. Despite this, it has not experienced a robust bullish resurgence. If the $0.6 level holds, there is potential for an upward movement towards the $0.72 resistance level in the short term.
Conversely, a breach of the $0.6 level could lead to a descent towards the 200-day moving average, positioned close to the $0.54 threshold. It's worth noting that falling below this moving average would carry significant bearish implications, with the subsequent major support at the $0.45 range.
 Source: TradingView
Examining the BTC Paired Chart
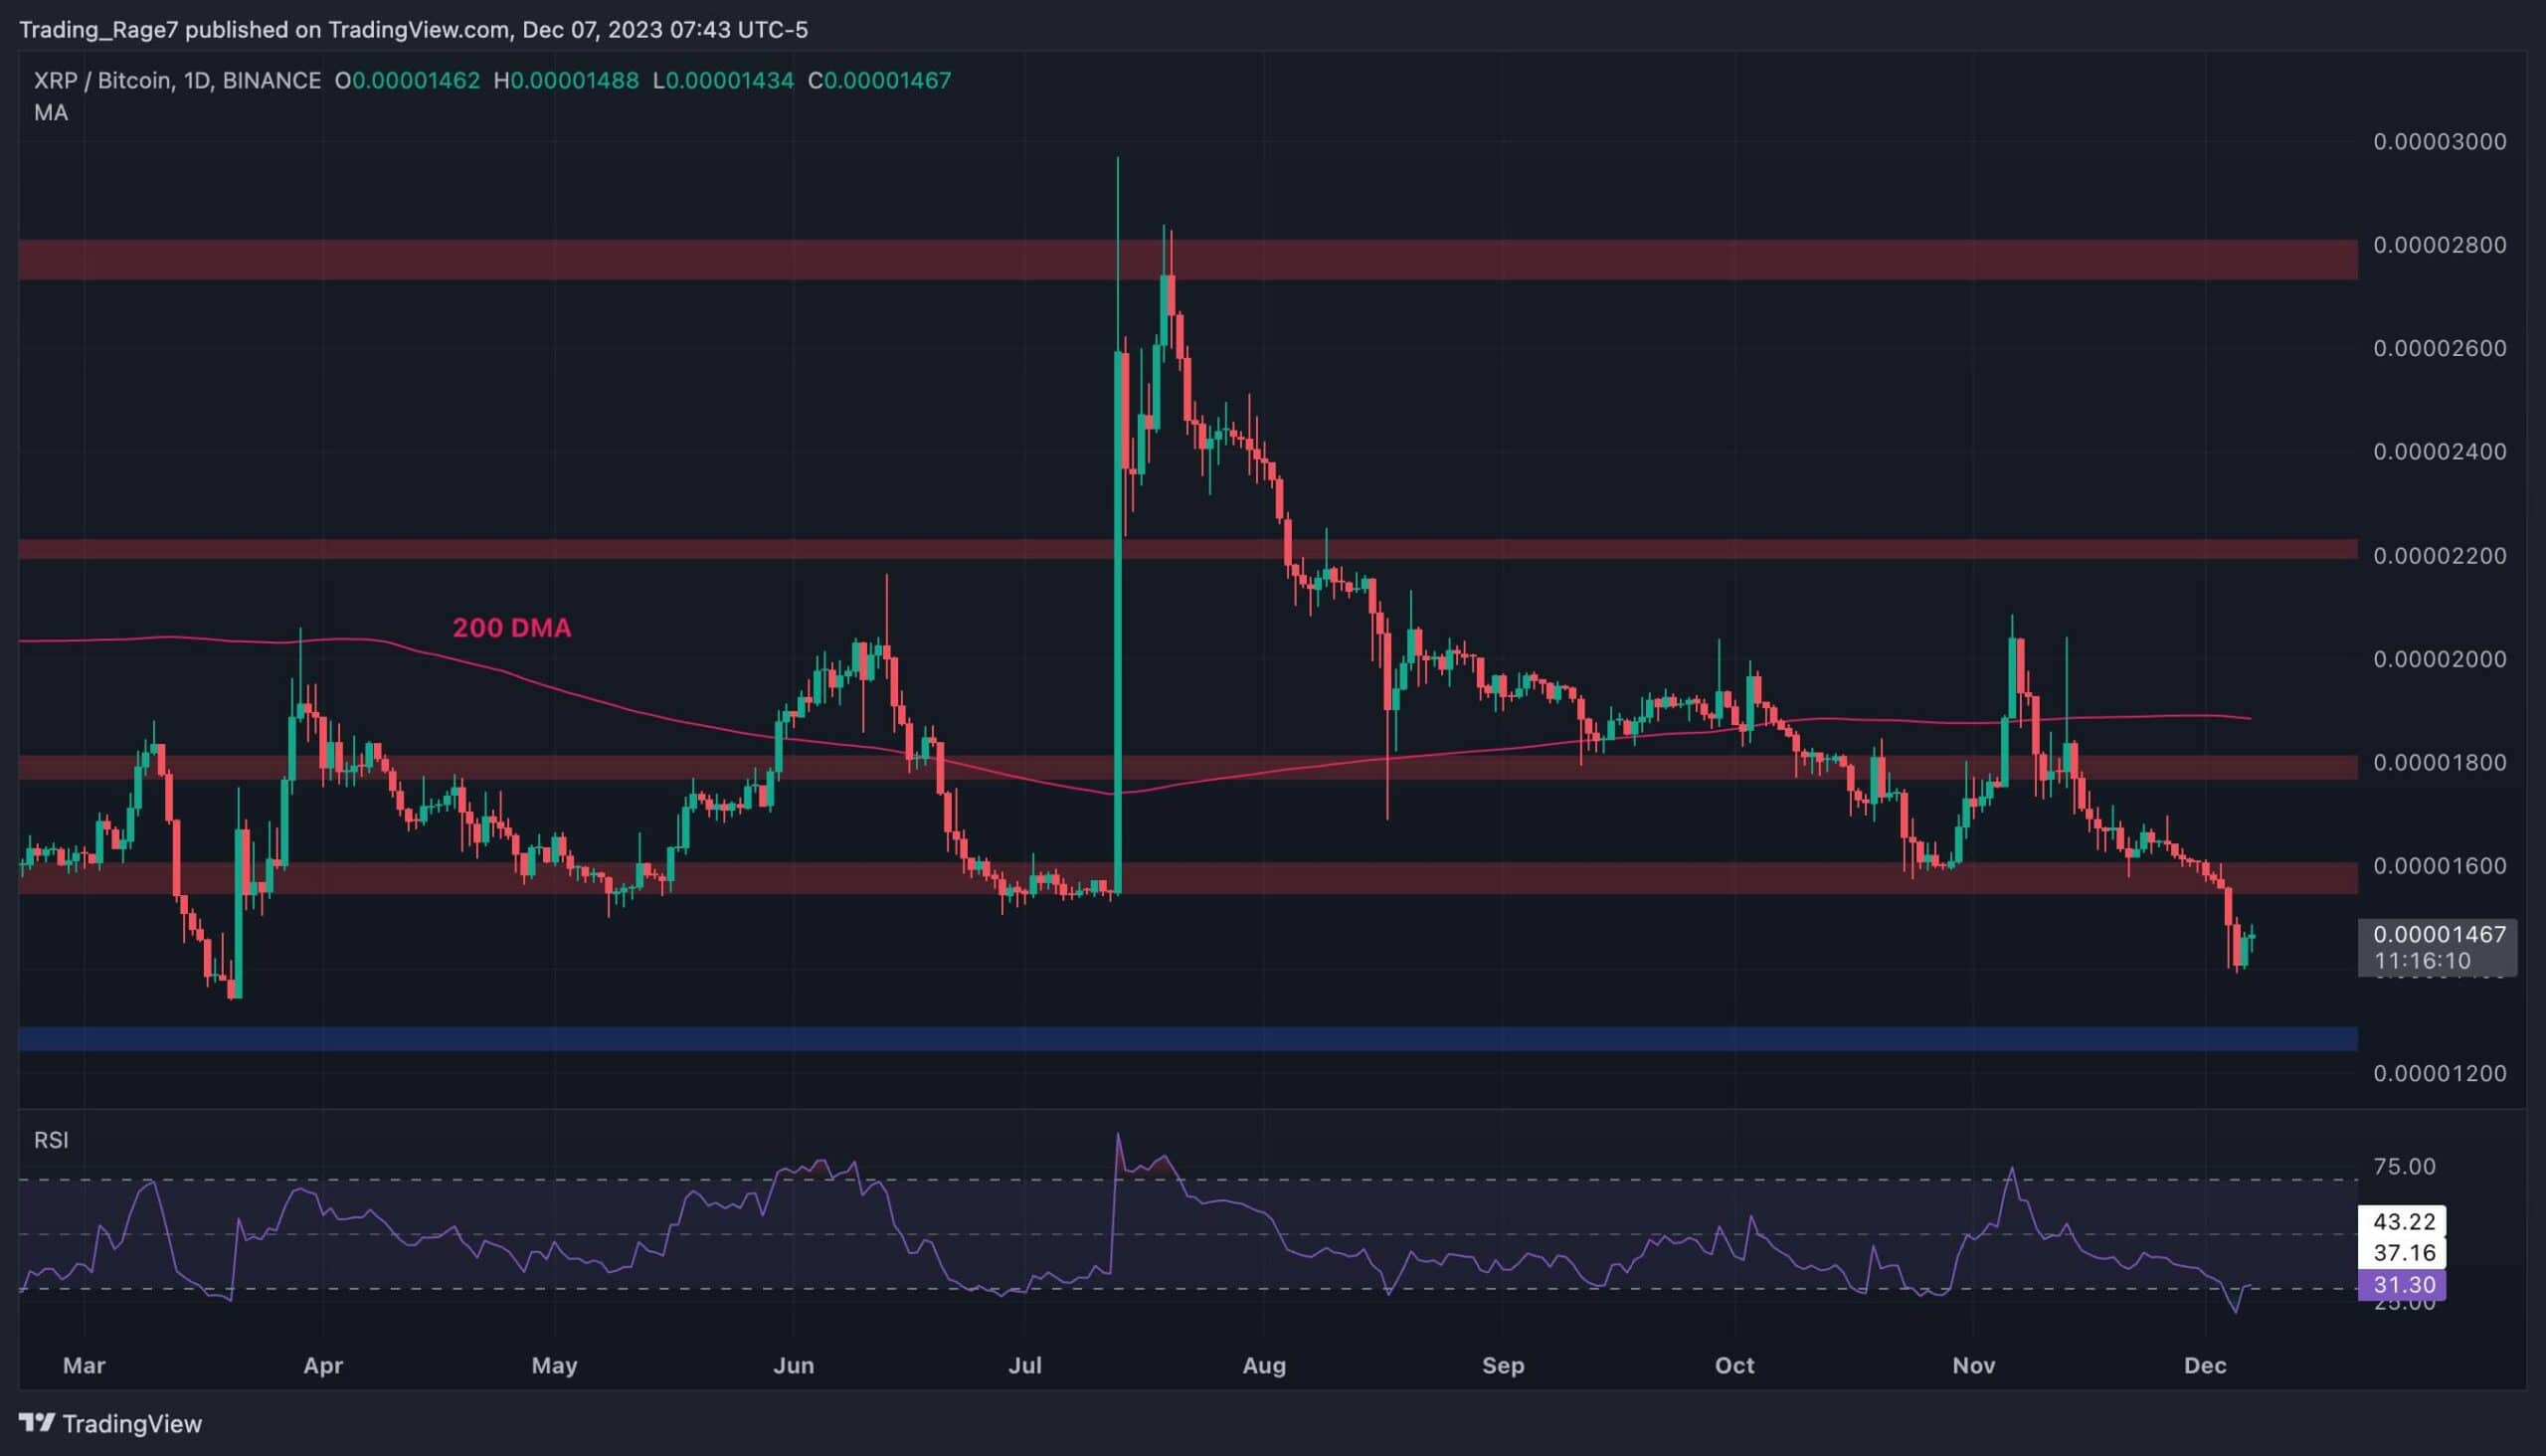
Against BTC, the price has consistently been establishing lower highs and lower lows, having breached both the 1800 SAT and 1600 SAT support levels.
However, a probable retracement towards the previously breached 1600 SAT zone, now transformed into a resistance level, seems likely based on the observed price action. The relative strength index indicates an oversold condition, heightening the likelihood of such a retracement in the days ahead. If the level sees rejection, it could pave the way for a further decline towards the 1250 SAT support zone. In light of these dynamics, the market's movements against BTC diverge significantly from its behavior on the USDT pair.
 Source: TradingView
Read more: CryptoSaga: Bitzlato's Downfall

Trending


Press Releases

Deep Dives


