Ethereum's Price Dance: Hurdles and Surges

After hovering around the $1,500 mark for a while, Ethereum enthusiasts made a comeback, triumphantly reclaiming the $2,000 resistance area.
Nevertheless, in the aftermath of a notable upswing, ETH finds itself grappling with a critical price range, currently encountering hurdles in its bid to overcome it.
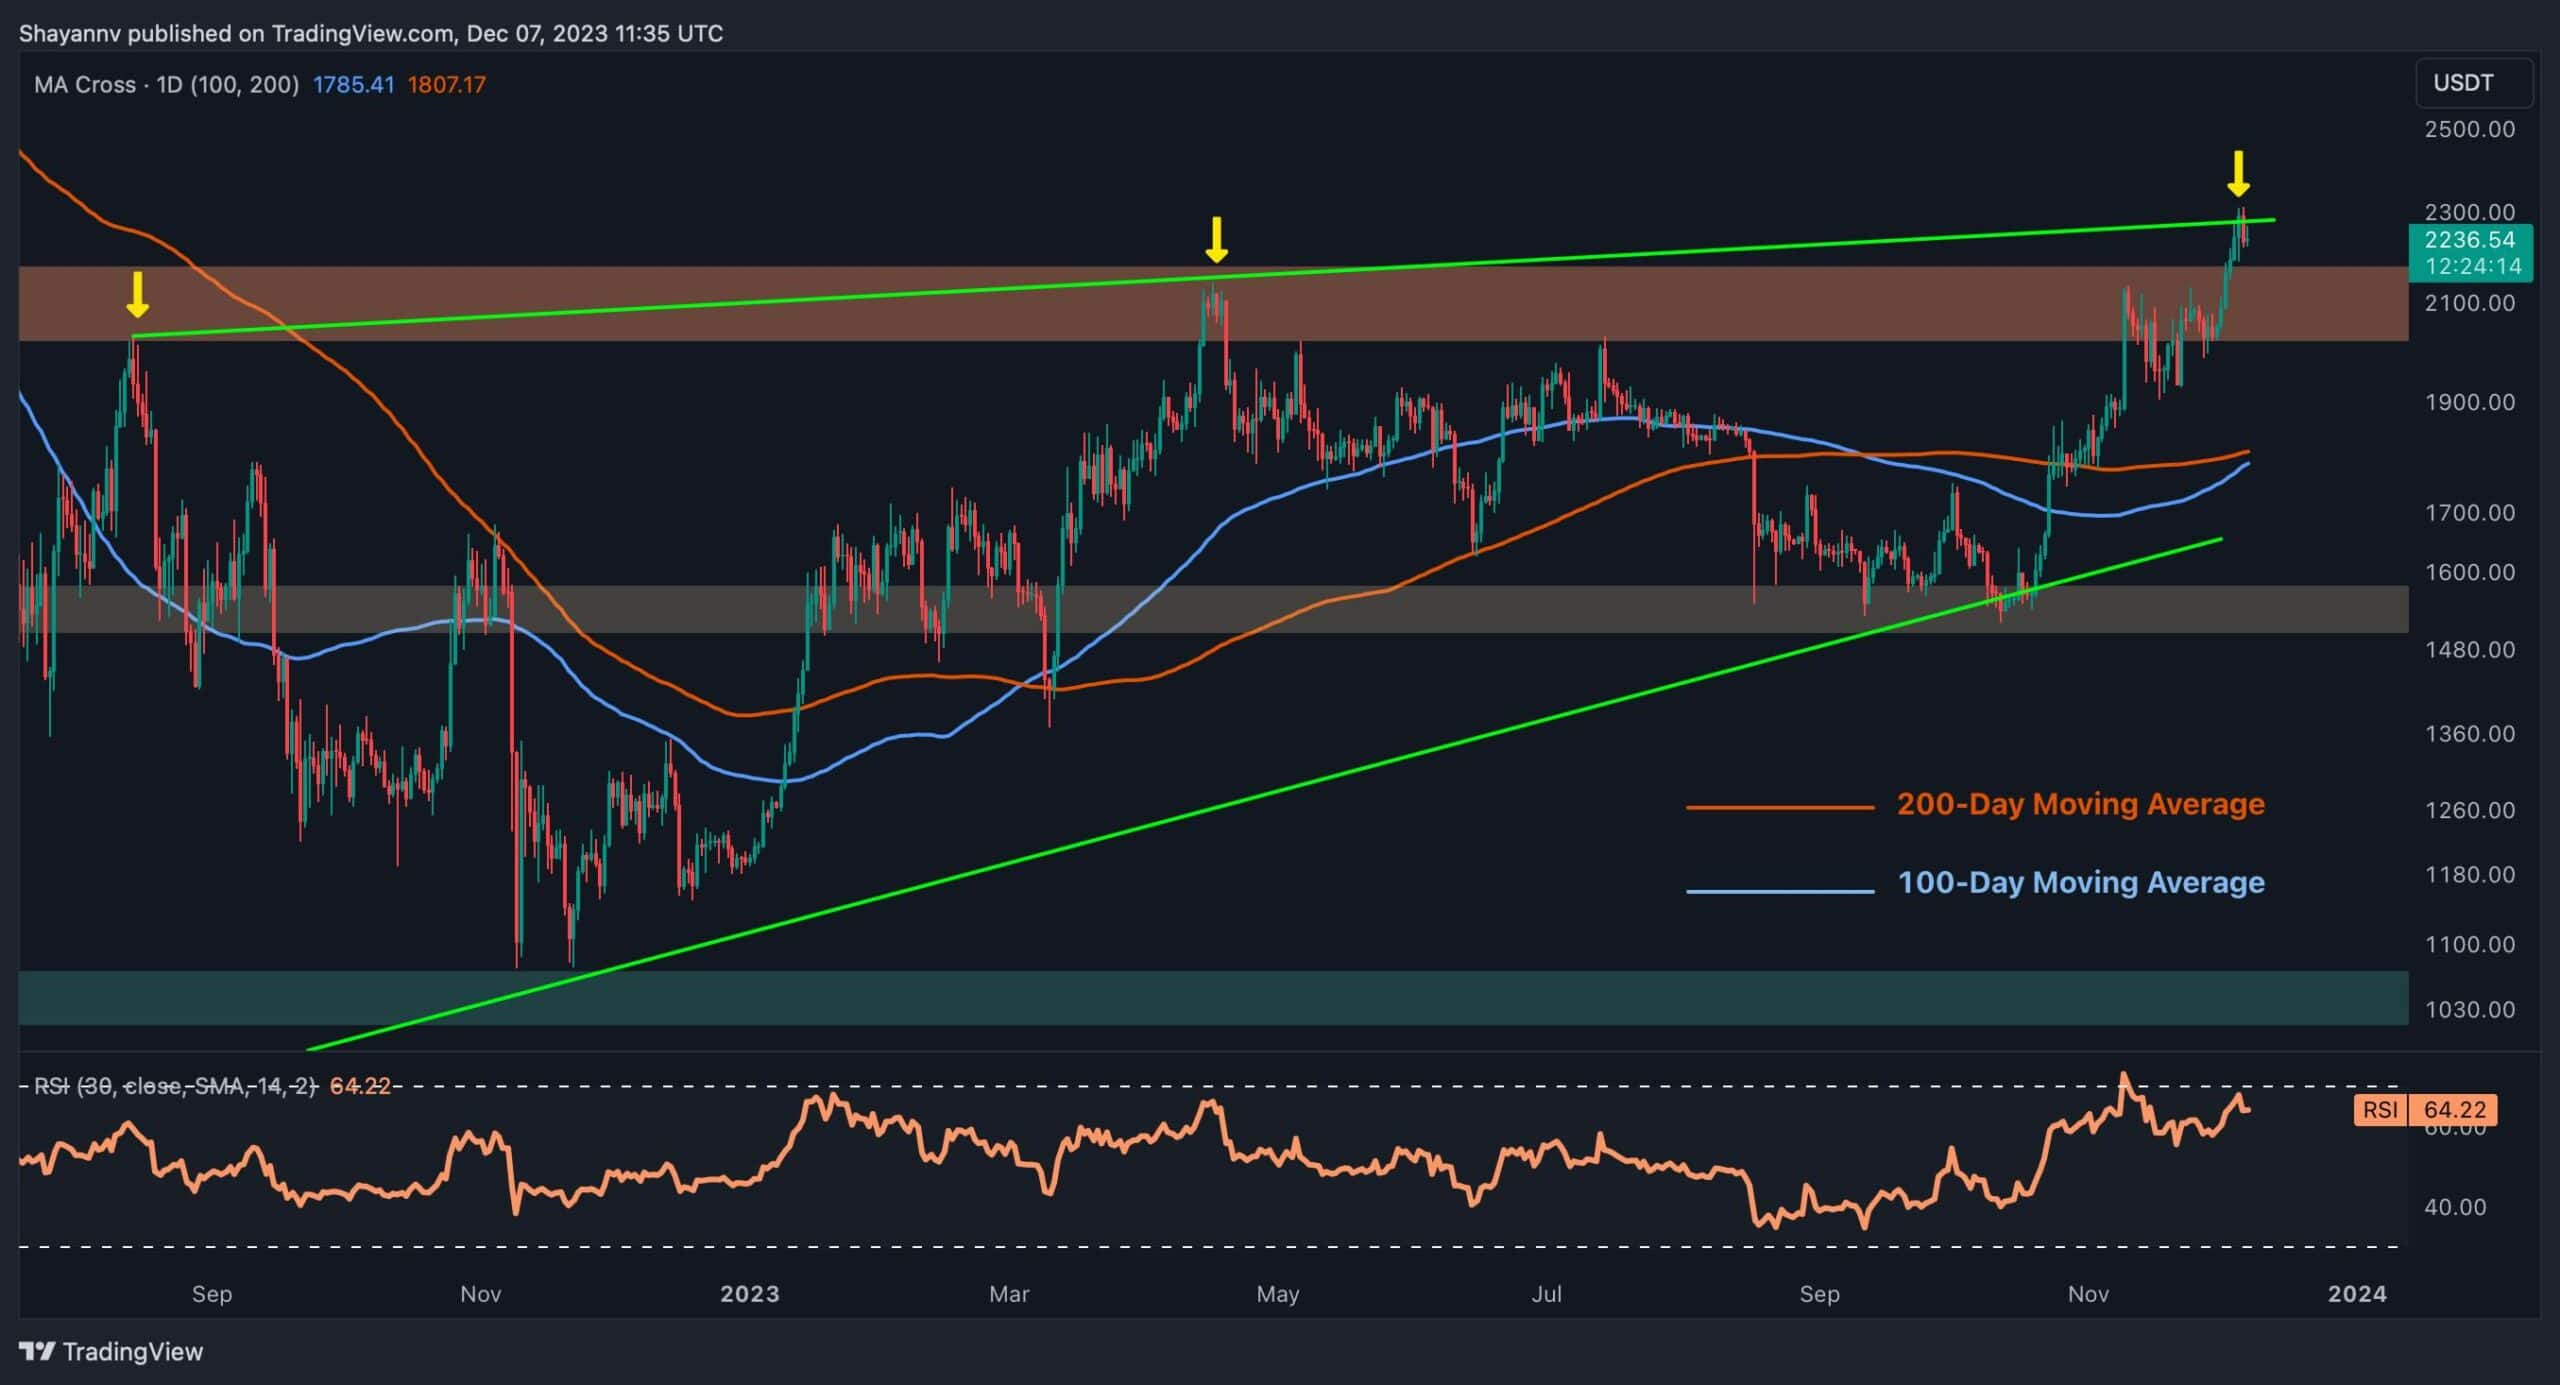
Daily Chart
Over the last couple of months, Ethereum has been riding a favorable wave, consistently ascending. This increased buying fervor facilitated the surge past the significant $2,000 resistance, resulting in a sustained rally. As a consequence, the price of ETH has recently spiked sharply, setting its sights on the pivotal $2,300 resistance zone.
This particular price bracket poses a substantial challenge for Ethereum buyers, incorporating the steadfast resistance at $2,300 and the dynamic resistance from the upper trendline of the Wedge.
The trendline has proven to be a formidable barrier thrice, impeding Ethereum's upward trajectories. Nevertheless, if the price manages to successfully recapture this critical zone, the $2,500 mark might be the subsequent destination for Ethereum, but navigating these waters may prove to be quite intricate.
 Source: TradingView
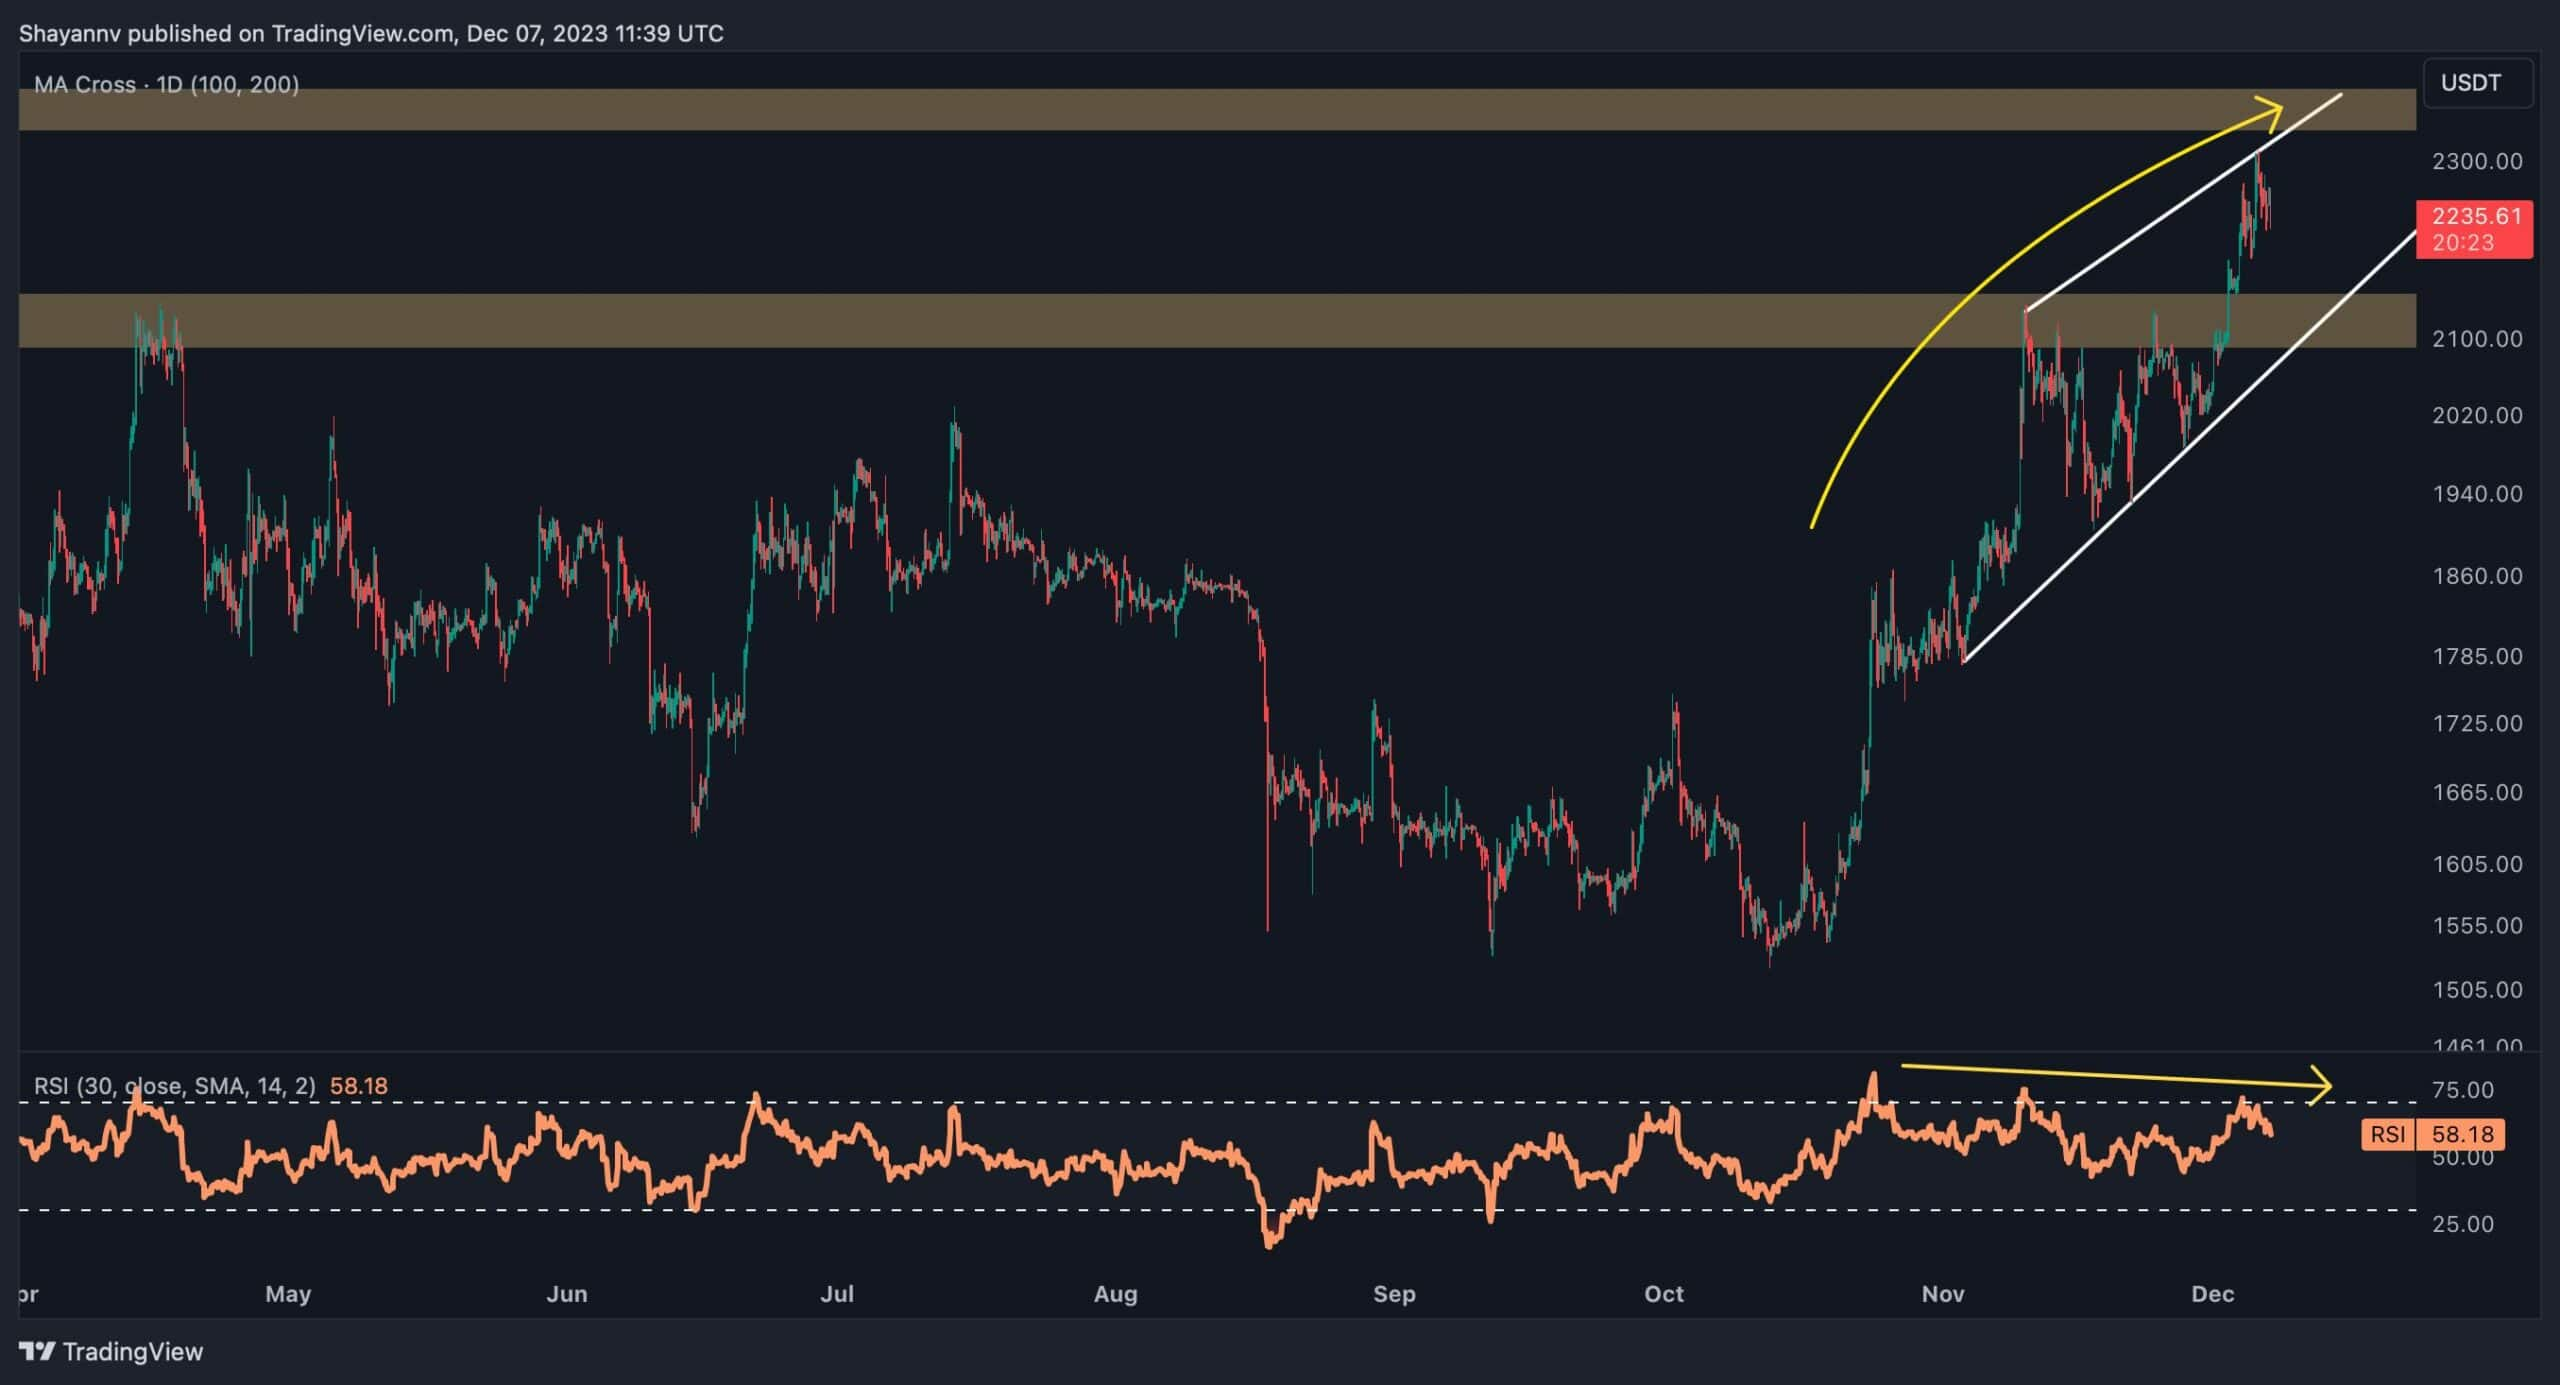
4-Hour Chart
Scrutinizing the 4-hour chart unveils that, having found support around the $1,500 mark, Ethereum embarked on a robust upward trend, showcasing the dominance of buyers. This resulted in a significant surge, shattering multiple resistance levels, including the crucial $2,000 resistance.
However, upon reaching the pivotal $2,400 resistance region, the upward momentum dwindled, and the price formed an ascending wedge pattern.
Simultaneously, a bearish divergence between the price and the RSI indicator expanded over two months, indicating a potential overvaluation of Ethereum at present.
Given the prevailing market dynamics, while the overall sentiment remains bullish and buyers seem to be steering the ship, there's a noteworthy likelihood of a transient consolidation correction phase in the short term, coupled with heightened volatility.
Nonetheless, if there's an abrupt breakthrough above the decisive $2,400 resistance zone, the market could witness a substantial surge, possibly charting a course toward loftier resistance levels.
 Source: TradingView
On-chain Analysis
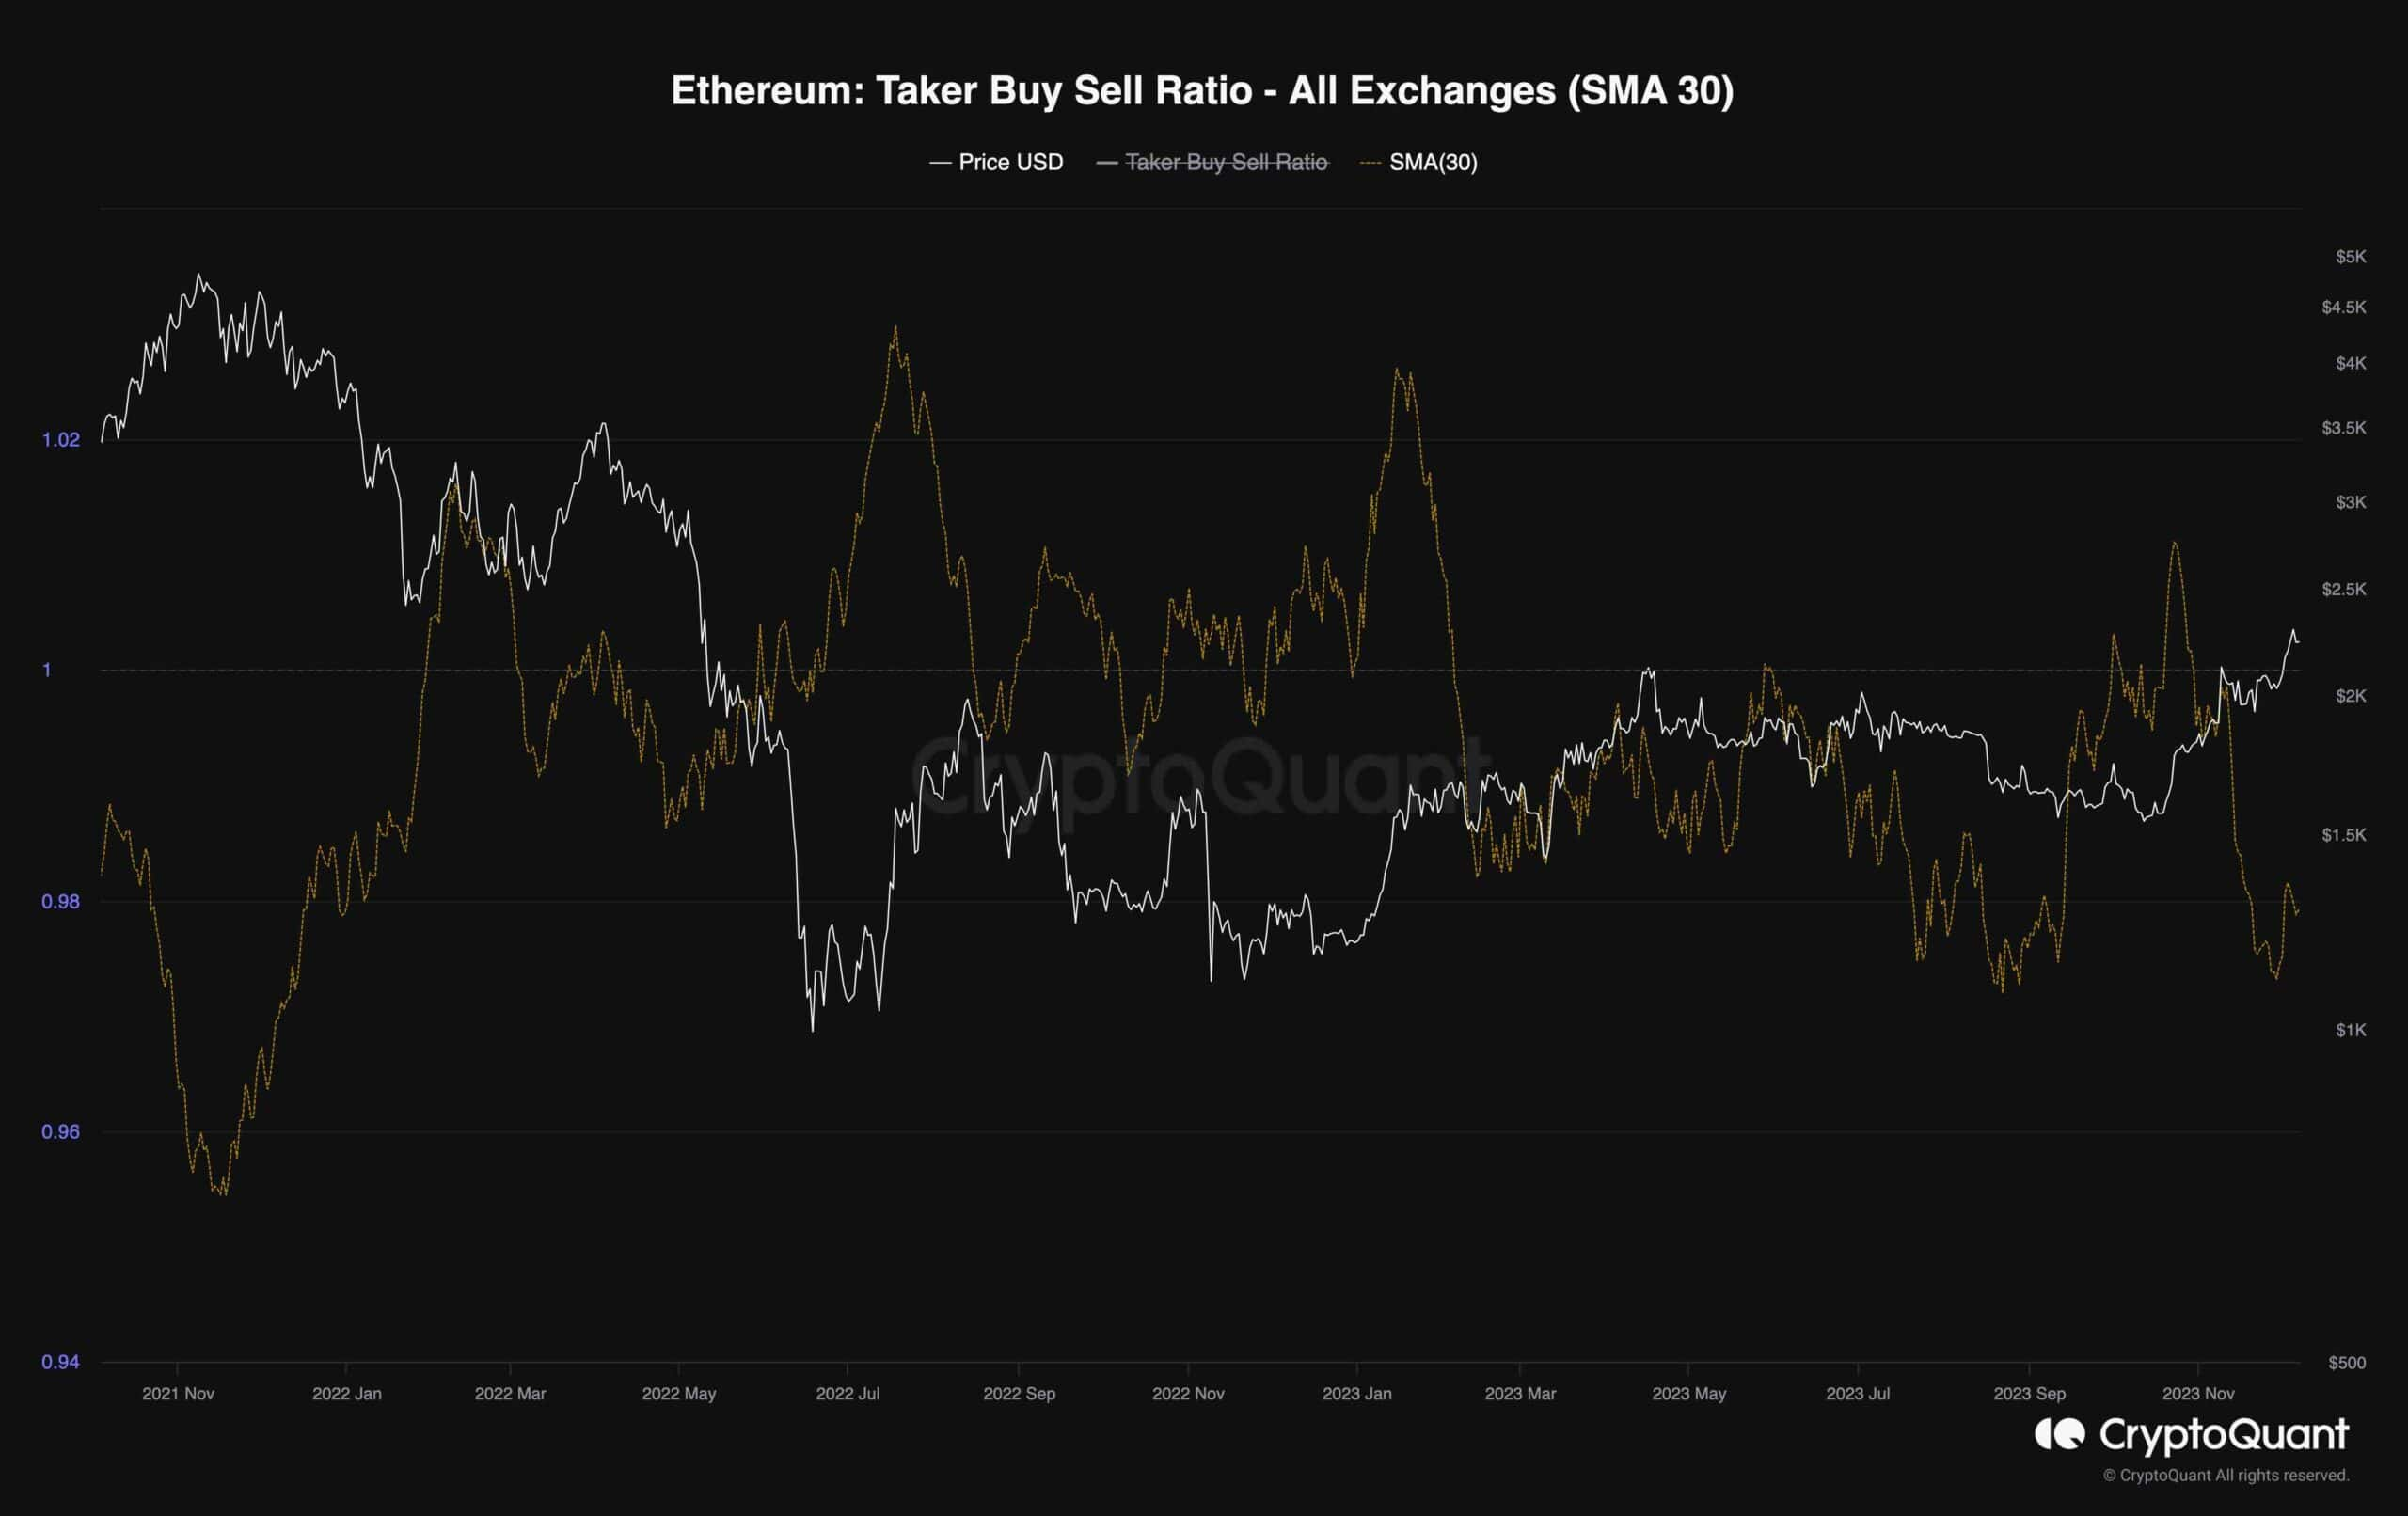
Ethereum's price has recently displayed a significant upward trajectory, breaking free from months of consolidation and gradual decline.
This surge has sparked a palpable bullish sentiment, reigniting demand in the market. The accompanying chart depicts the 30-day moving average of the taker buy-sell ratio metric, a valuable gauge for assessing futures market sentiment. Values below 1 denote a bearish sentiment, while those above 1 signal a bullish sentiment.
Interestingly, the taker buy-sell ratio metric has experienced a noticeable decline, dropping below 1 in tandem with Ethereum's substantial surge to higher price levels. This development hints at the possibility of an imminent correction phase, as the significant dip in the metric suggests that market participants might see this price range as an opportunity to cash in on profits by selling their Ethereum holdings.
Consequently, there's a potential for the market to undergo a consolidation correction phase before determining its next move. This cautious outlook stems from the observed disparity between the surging price and the declining taker buy-sell ratio, indicating a potential shift in market dynamics.
 Source: CryptoQuant
Read more about: Ethereum's Gwei Surge: Unveiling Dynamics of Gas Fees and Network Resilience

Trending


Press Releases

Deep Dives


