ETH Price Dynamics: Charts Unveiled
The Daily Graph
Examining the daily chart reveals a pronounced bullish trend since October. Furthermore, the market has once again surpassed the crucial 200-day moving average, a pivotal trend indicator. With the ascent of ETH above this moving average, the bullish shift in trend is officially confirmed.
However, the current hurdle preventing ETH from advancing lies around the $2,400 mark. Presently, there is a likelihood that the market will revisit the support levels of $2,100 or even $2,000. These levels could potentially serve as a catalyst for a bullish price rebound, setting the stage for ETH to target values exceeding $2,400 in the weeks ahead.
 Source: TradingView
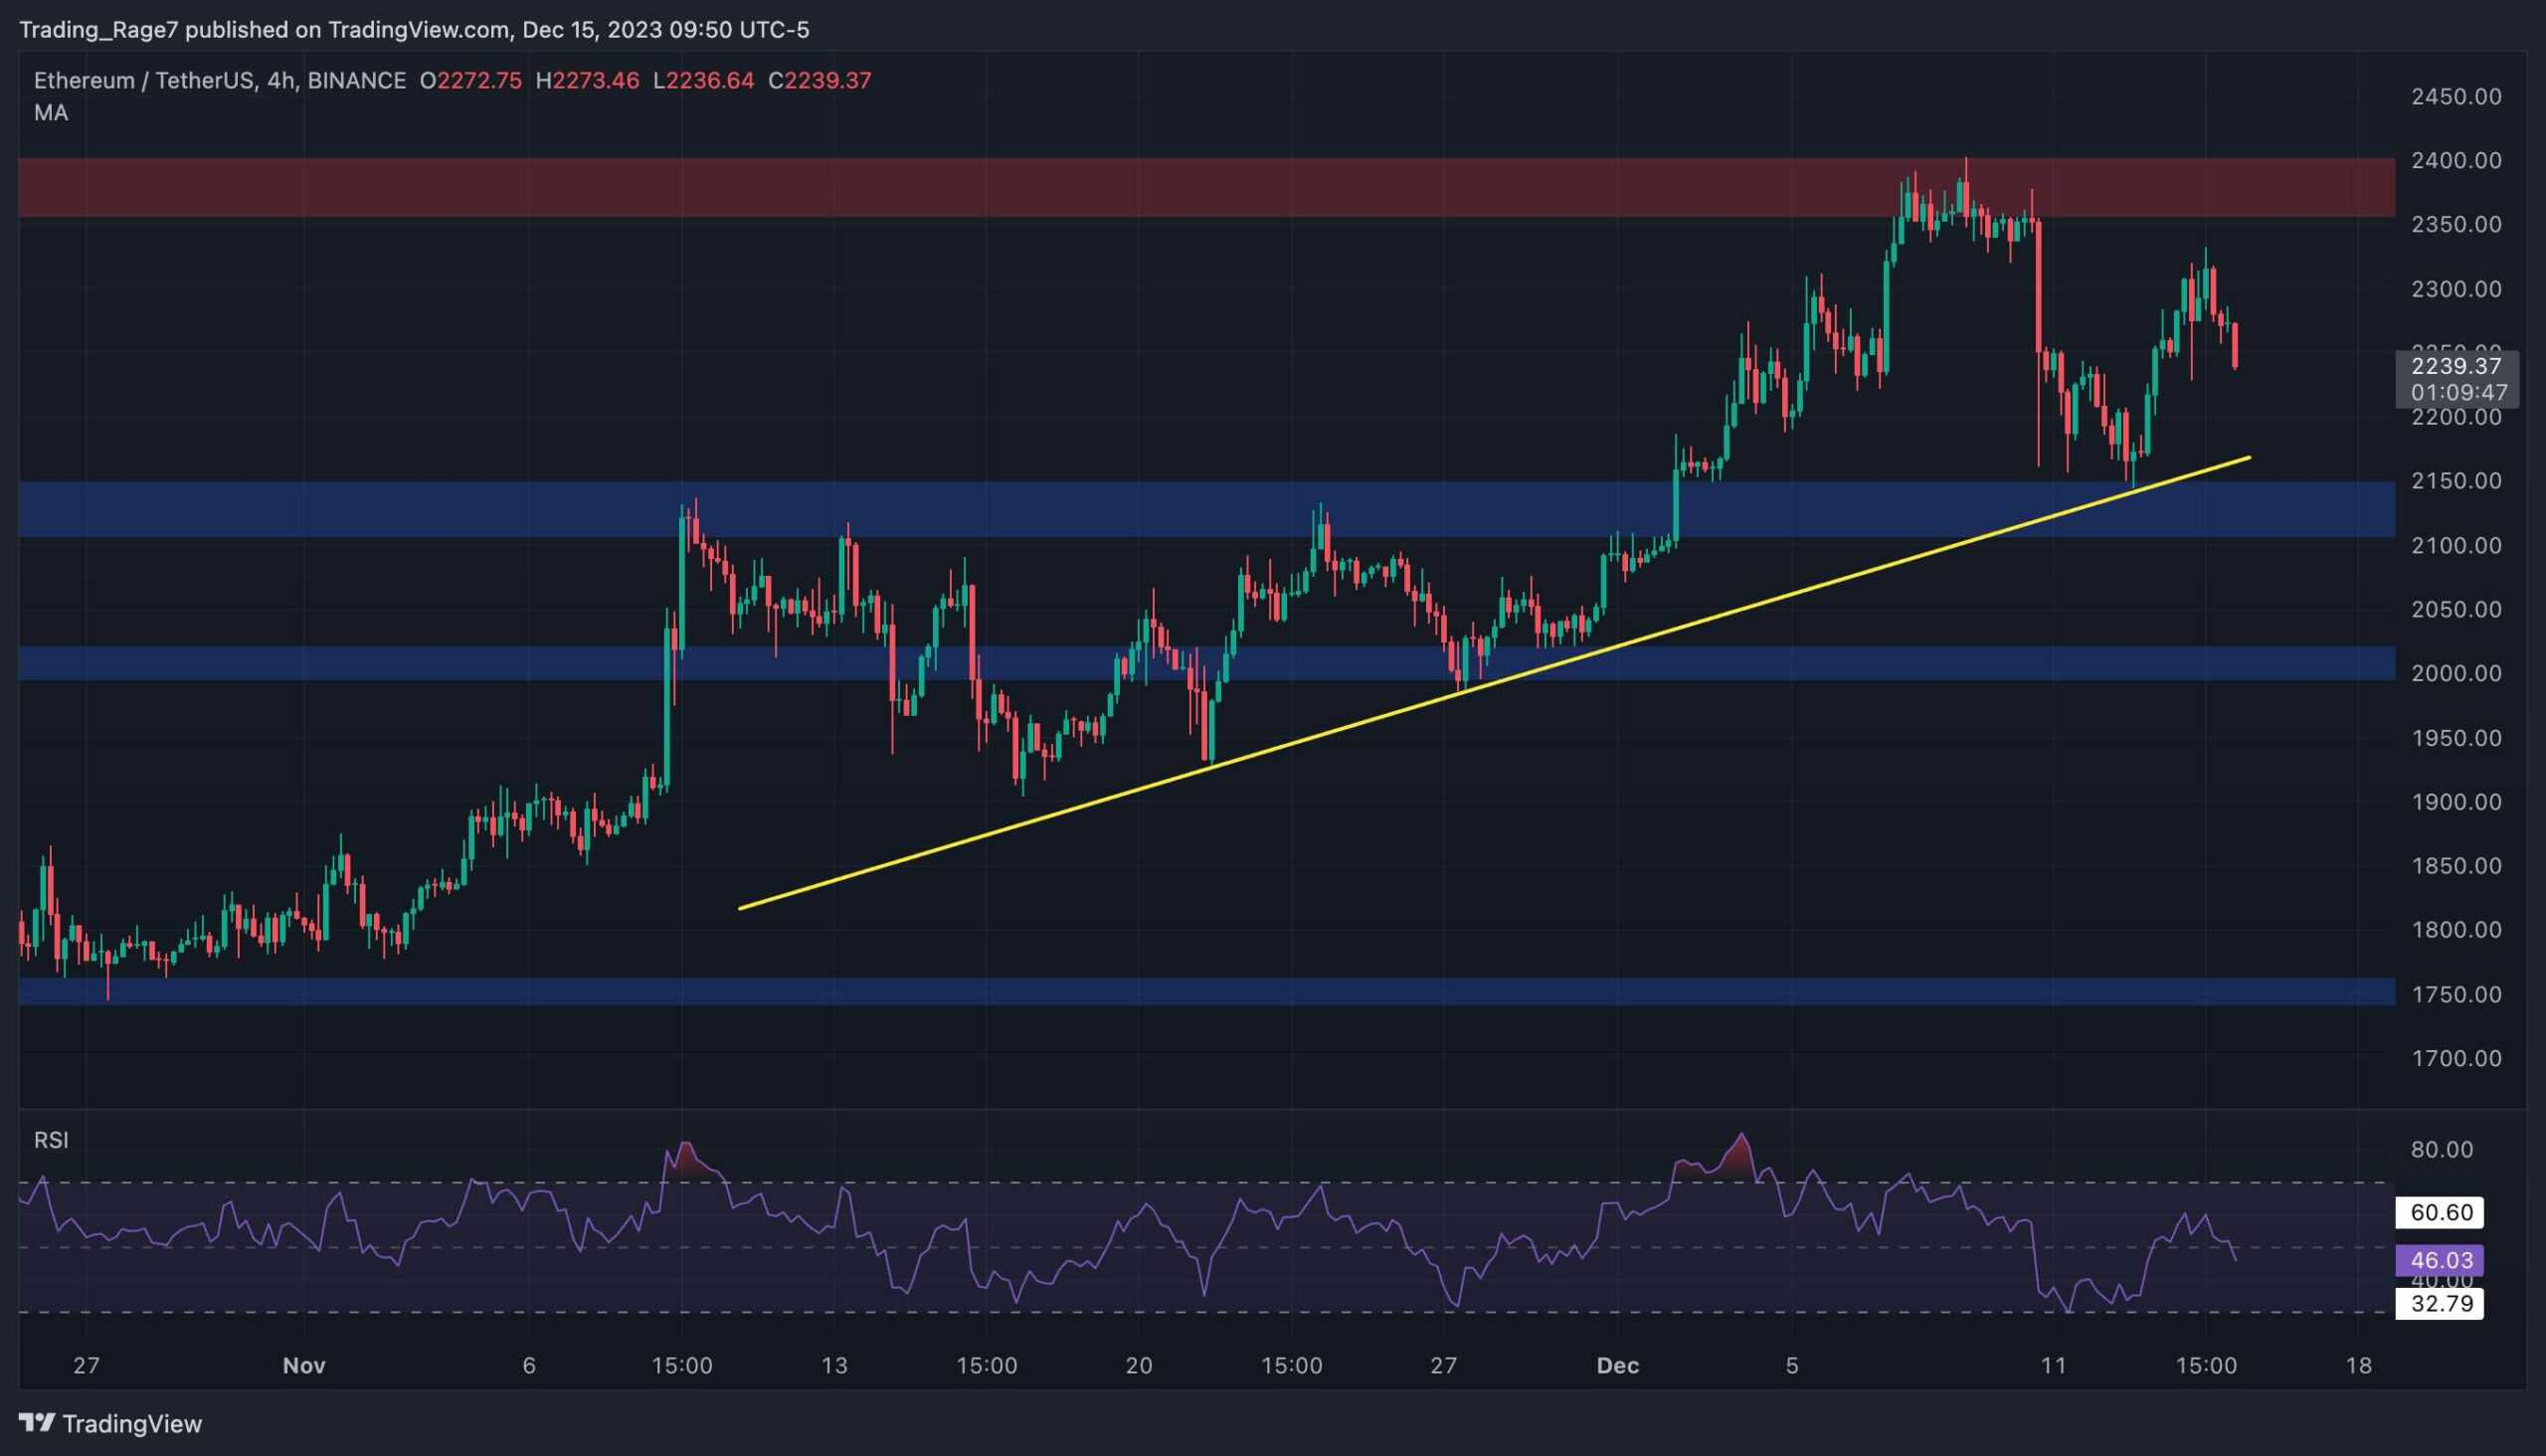
The 4-Hour Graph
Things take a slightly more intricate turn on the 4-hour chart. The price has been closely following the depicted bullish trendline in recent weeks.
Yet, it is presently descending once again toward the trendline. While traders can anticipate another bounce from this level, there exists a potential scenario of a breakdown. In this latter circumstance, a negative turn of events might unfold, leading to a more profound correction in the near term.
 Source: TradingView
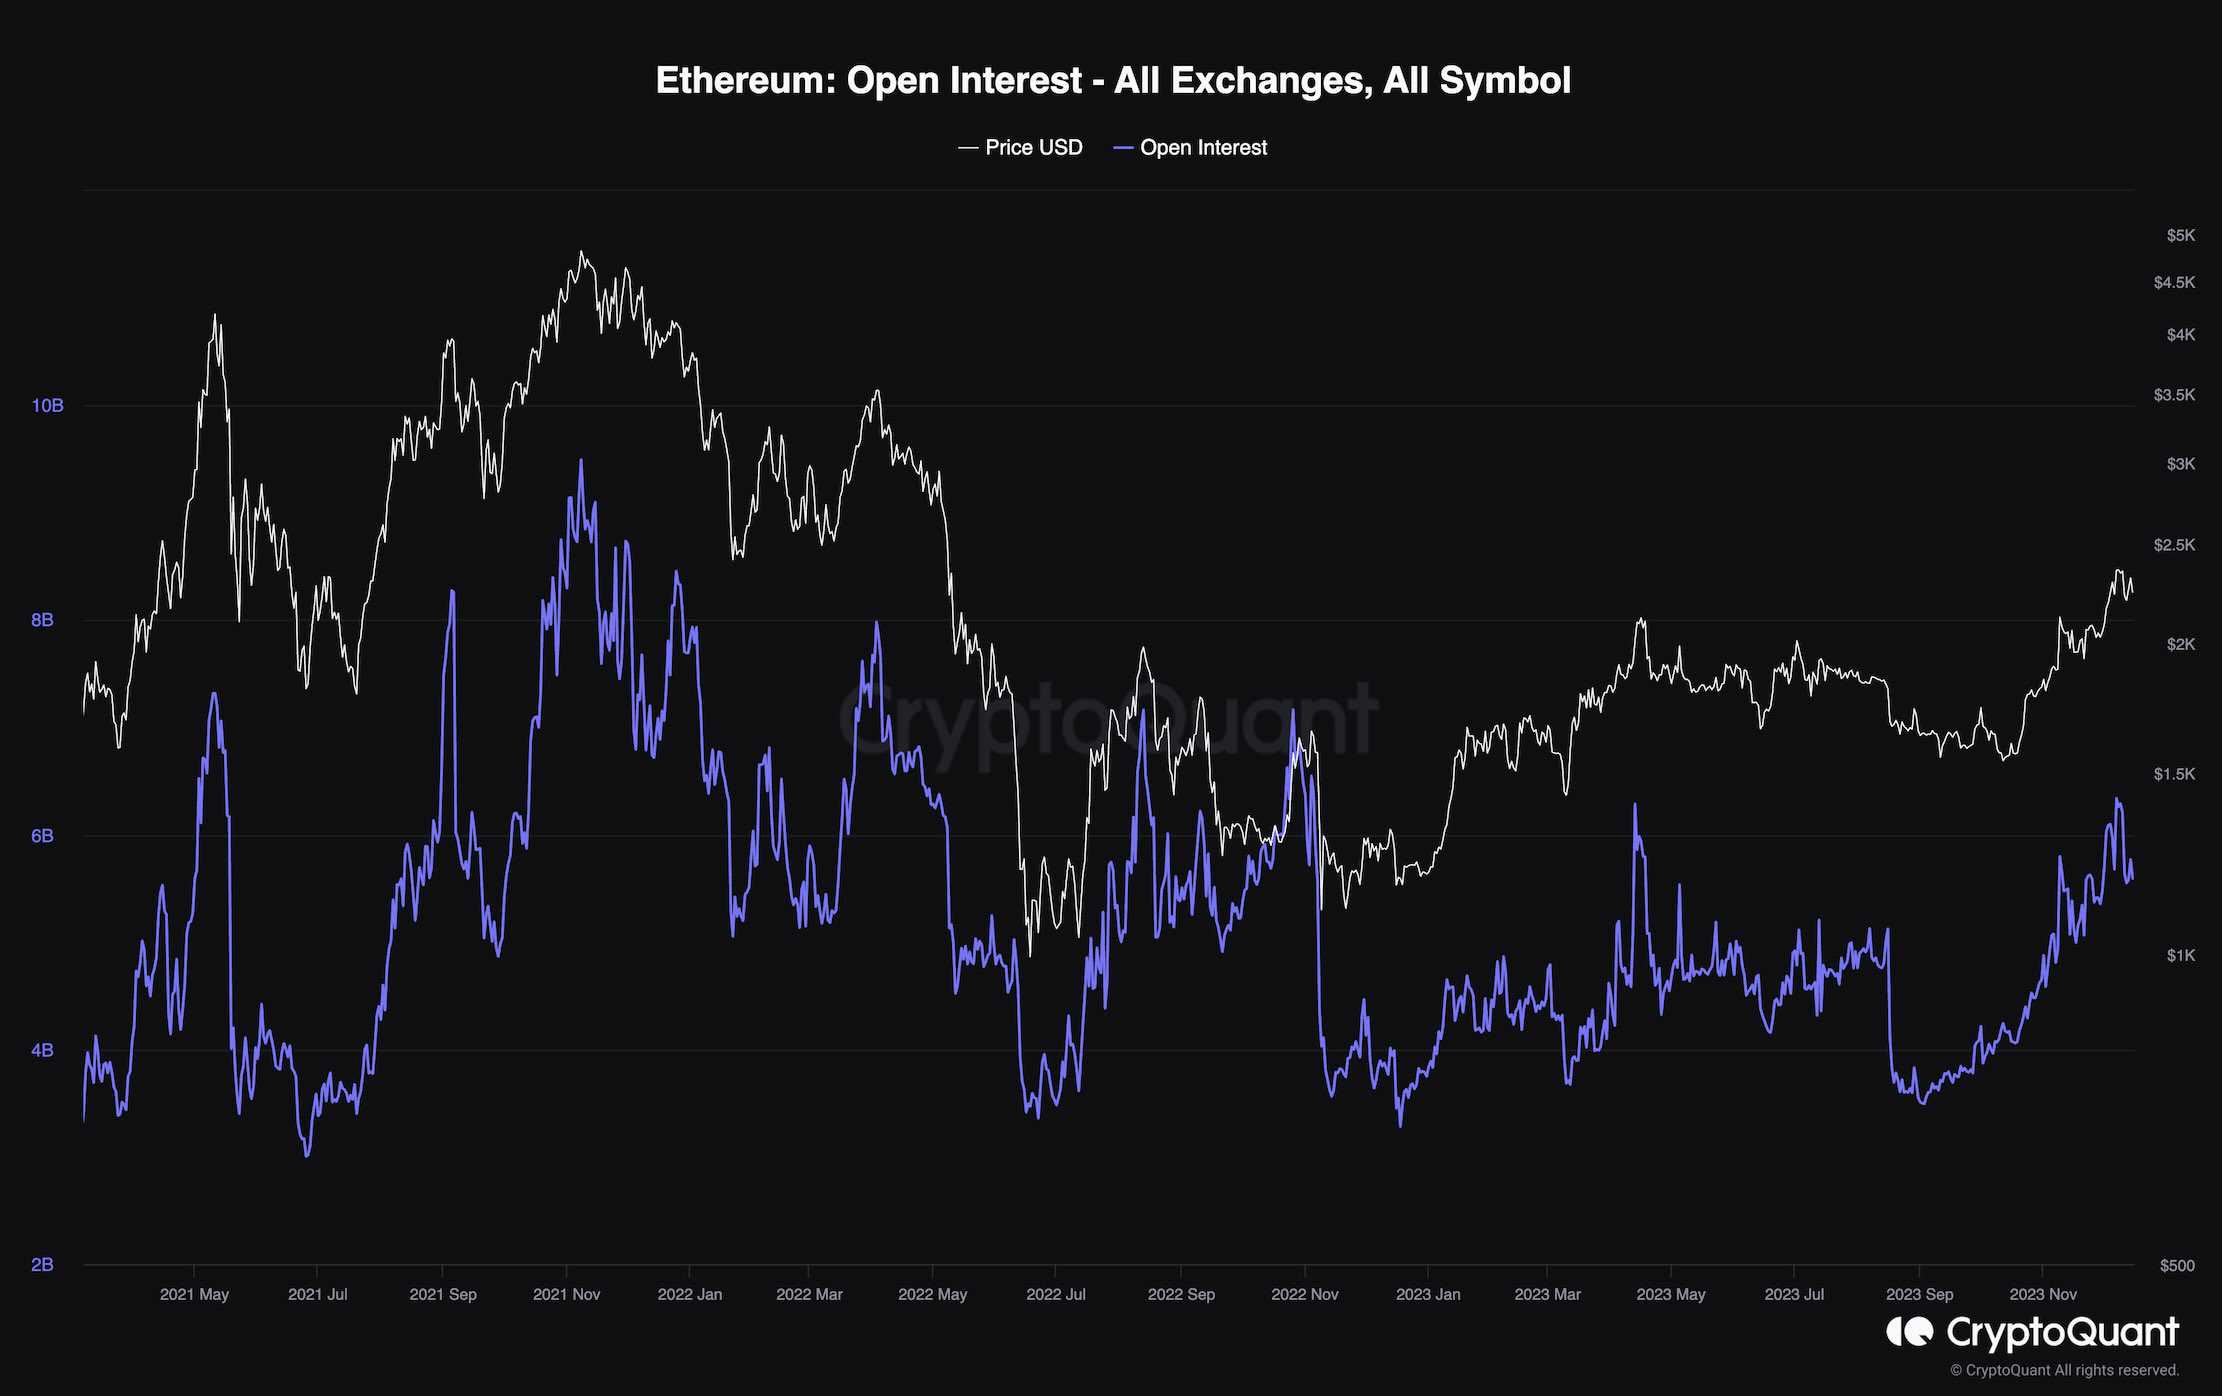
Ethereum Open Interest
Ethereum's value has steadily climbed over the past few months, transitioning from below $1,000 per coin to over $2,000. Meanwhile, an analysis of sentiment in the futures market can offer valuable insights to investors.
This chart illustrates the open interest metric across all exchanges, measuring the number of open futures contracts irrespective of trade direction. Elevated values signify confidence among futures traders in the trend's direction, while lower values indicate uncertainty. Additionally, higher open interest levels correspond to increased price action volatility, as the likelihood of cascading liquidations rises.
As depicted in the chart, the price has been on an upward trajectory, accompanied by a consistent increase in open interest. Despite the absence of significant spikes, the metric is gradually on the rise. This behavior suggests that the ongoing uptrend may be sustainable, as the futures market has not yet reached an overheated state.
 Source: CryptoQuant
You might also like: Ripple's Dance: Chart Chronicles

Trending


Press Releases

Deep Dives


