Русский
- Home
- Cryptocurrency
- Cryptocurrency Market Insights
Cryptocurrency Market Insights

Bitcoin, the flagship cryptocurrency, recently made an attempt to break free from its well-established trading range. However, despite these efforts, the bullish momentum was unable to sustain the higher price levels. Bitcoin (BTC) now finds itself back within the familiar range, hovering closely around the $26,000 threshold. Over the course of the past several days, intriguingly, we have observed the emergence of not one, but two successive doji candlestick patterns on the weekly chart. These patterns are indicative of a certain level of ambiguity in the market, leaving traders and analysts pondering the possible directions Bitcoin might take in the near future.
Predicting the direction in which Bitcoin will break out from this range is currently a task fraught with complexity. In the short term, it appears that a downside move may be somewhat constrained, primarily because of the expectations pinned on the United States Securities and Exchange Commission (SEC). There's a growing belief in the industry that the SEC may eventually grant approval to one or more pending applications for a Bitcoin exchange-traded fund (ETF). Interestingly, Jay Clayton, former SEC Chair, has expressed a notable degree of confidence, stating in a recent interview that an approval decision is, in his view, almost inevitable.
 Daily insights into cryptocurrency market data from Coin360
In the immediate horizon, discerning a specific catalyst that could potentially jolt Bitcoin out of its current state of equilibrium is indeed challenging. This murkiness surrounding Bitcoin's next major trend has, unsurprisingly, placed substantial downward pressure on most major altcoins. However, it's worth noting that a handful of altcoins have managed to exhibit glimmers of short-term strength. With this backdrop, let us delve deeper into the charts of the top five cryptocurrencies that could conceivably embark on a significant rally if they succeed in surmounting their respective resistance levels.
Bitcoin Price Analysis:
Turning our attention to Bitcoin's price action, we find that it has reverted back into the well-established trading range of $24,800 to $26,833. One positive signal amidst this oscillation is the unwavering resolve of the bulls to snap up any price dips, a testament to their commitment, as evidenced by the elongated lower shadow on the candlestick chart for September 1.
 Daily chart for the BTC/USDT pair sourced from TradingView
The bearish tone is underscored by the downward trajectory of the moving averages, yet a silver lining emerges in the form of the slowly recovering relative strength index (RSI), suggesting a possible weakening of bearish momentum. A watershed moment would be signaled by a decisive breakthrough and closure above the $26,833 range, potentially catapulting the BTC/USDT pair to retest the intraday high reached on August 29, which stood at $28,142.
In the event that the bears seek to wrest control, their arduous task would entail plunging and sustaining the price below the $24,800 mark. This challenge is not to be taken lightly, as the bulls are likely to mount a resolute defense at this level. However, if the bears manage to prevail, the pair could potentially plummet to the psychologically significant $20,000 threshold. While there exists a minor support level at $24,000, it may prove insufficient to halt the descent.
 Source: TradingView, BTC/USDT 4-hour chart
Despite the bears' attempts to push the price below the immediate support level of $25,300, the bulls managed to hold their position. The next move for the buyers will be to strengthen their position by pushing the price above the 20-day exponential moving average (EMA), signifying the potential start of a more robust recovery.
While the 50-day simple moving average (SMA) could pose a hurdle, there's a possibility it will be overcome, potentially paving the way for a rally toward the resistance at $26,833.
Conversely, sellers may have alternative strategies in mind. They'll aim to drive the price below $25,300 and challenge the critical support level at $24,800.
Analysis of Toncoin's Price
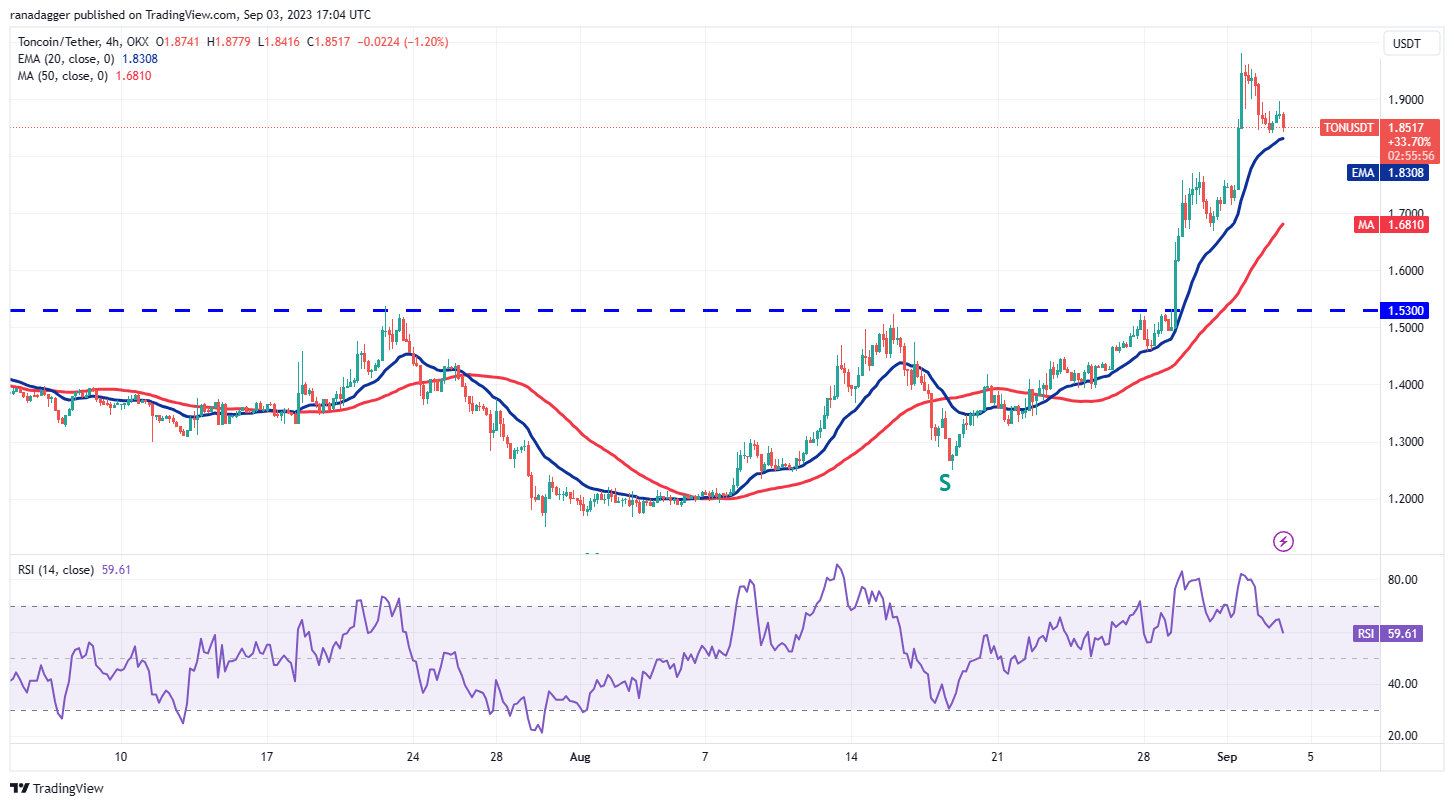
Toncoin (TON) has been experiencing an upward trend, although the bears are attempting to impede its progress around the resistance level of $2.07.
 Daily chart for TON/USDT sourced from TradingView
Furthermore, it's worth reiterating that the moving averages, though currently slanted downward, do favor buyers. Nevertheless, the RSI's overbought readings hint at the possibility of a minor correction or consolidation. Should the bulls stand their ground without conceding much territory from the present level, the likelihood of a rally above $2.07 increases, potentially setting the stage for the TON/USDT pair to ascend to $2.40.
On the flip side, a more substantial correction could bring the price down to the 20-day exponential moving average (EMA), currently situated at $1.58. A robust rebound from this level would signal an encouraging shift in sentiment, indicating that traders are inclined to buy during dips. Conversely, the overall trend could take a negative turn if the 20-day EMA support succumbs to selling pressure.
 Source: TradingView, 4-hour chart for TON/USDT
Zooming in on the four-hour chart, we observe an intriguing dynamic whereby bulls have consistently entered the fray during pullbacks to the 20-day EMA. This level assumes paramount importance as it holds the key to the pair's potential resurgence. Should the price mount a strong rebound from the 20-day EMA, it could potentially set the stage for a retest of the local high at $1.98. A successful breach beyond this level could conceivably open the door to confronting resistance at $2.07. Conversely, a breach below the 20-day EMA support would signify a bearish sentiment and could potentially initiate a deeper pullback, with the 50-day simple moving average (SMA) serving as the next level of contention. A successful bounce off this level may yet face challenges at the 20-day EMA, but clearing this hurdle would signal a resurgence of bullish sentiment.
Chainlink Price Analysis
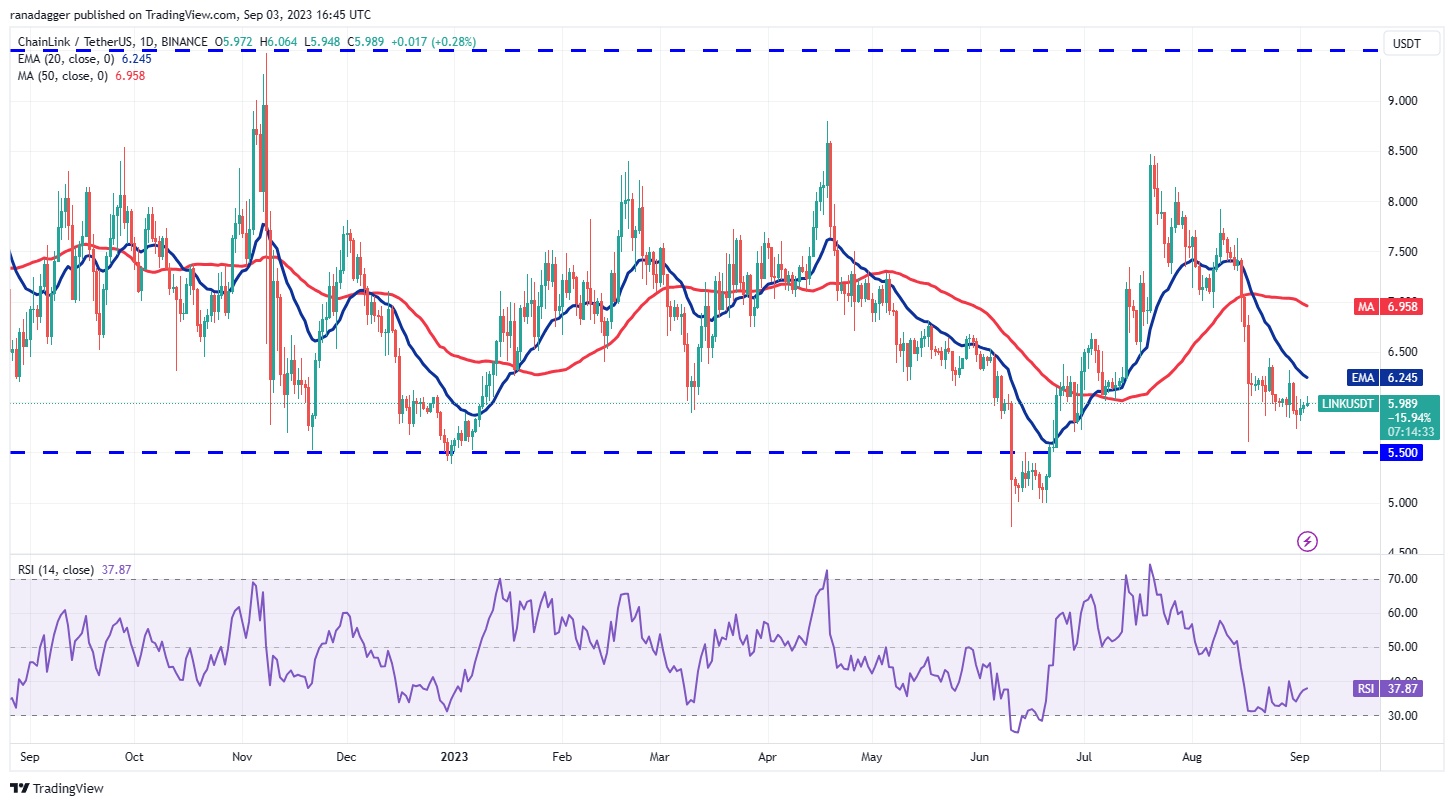
Turning our attention to Chainlink (LINK), we find that it has been treading water within a wide-ranging band spanning from $5.50 to $9.50 over the course of several months. On June 10, bears made a fleeting push to break below the support level within this range, but their efforts fell short of sustaining the price at these lower levels.
 Daily chart for LINK/USDT sourced from TradingView.
Interestingly, on August 17, the LINK/USDT pair ventured perilously close to the support range yet again, only to witness a swift response from the bulls. Their intervention is evident in the pronounced lower shadow on the candlestick chart, symbolizing their determination to shore up the price. As things stand, buyers are now setting their sights on a potential recovery, albeit one laden with challenges, notably resistance near the 20-day EMA, currently pegged at $6.24. This particular juncture assumes considerable importance and warrants close scrutiny.
Should buyers succeed in engineering a breakthrough beyond the 20-day EMA, this could well be the catalyst for the pair to embark on a trajectory towards the 50-day SMA, standing at $6.95. While a minor resistance at $6.40 does exist, it appears to be a mere hurdle that could be surmounted. However, a sharp reversal from the 20-day EMA would signal a persistent bearish sentiment, potentially pushing the price down to the lower end of the range at $5.50.
 Source: TradingView, 4-hour chart for LINK/USDT
On the four-hour chart, the moving averages have stabilized, and the RSI hovers close to the midpoint, indicating a potential decrease in selling pressure. To initiate a new upward trajectory, buyers must drive the price past the $6.40 mark, opening the possibility of reaching $6.87 and subsequently $7.07.
Conversely, a retreat from the $6.40 level could be a sign that bears are capitalizing on rallies. This scenario might prolong the pair's confinement within the range of $5.50 to $6.40 for an extended period.
Maker (MKR) price evaluation:
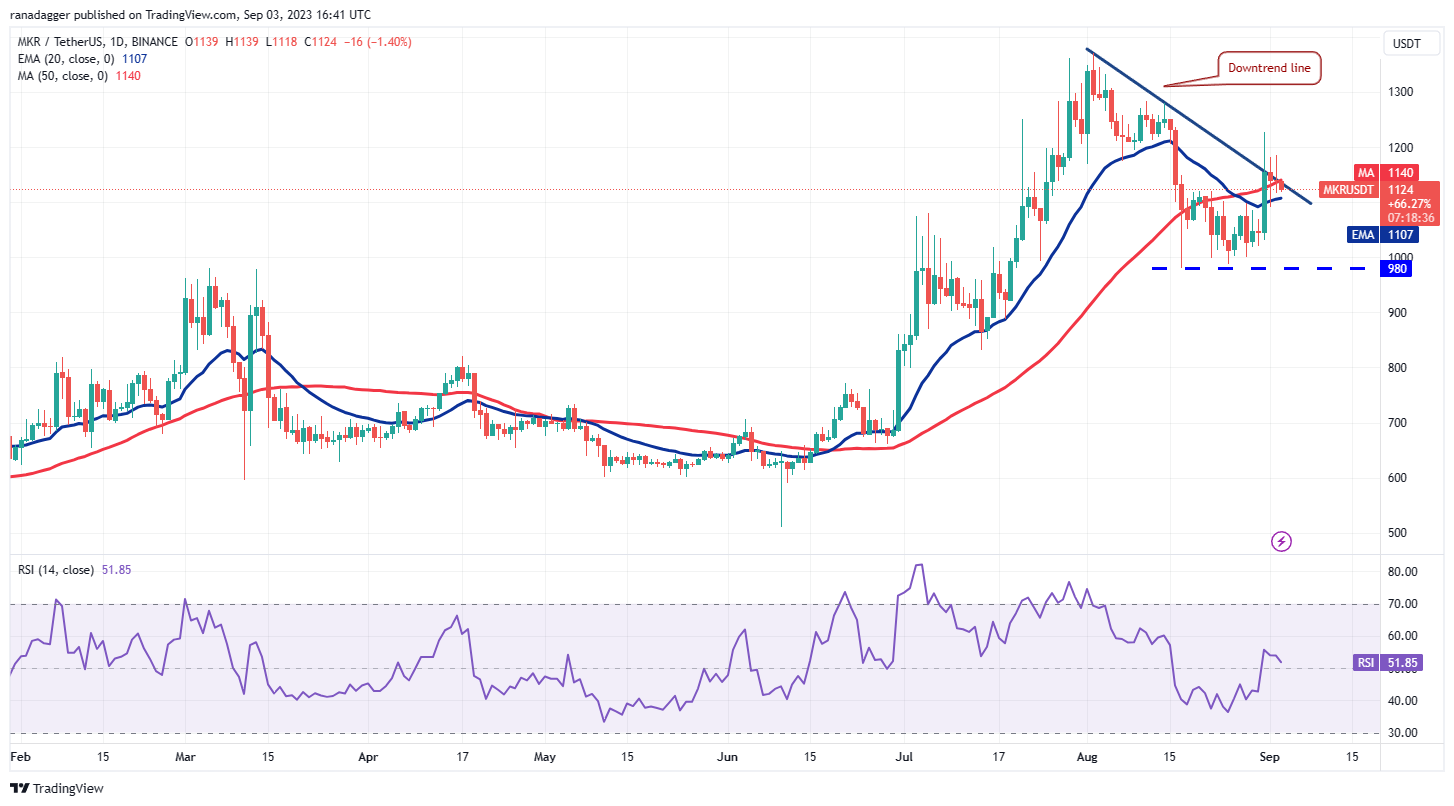
Maker (MKR) is currently showing support around the $1,000 mark and is striving to recommence its upward momentum. Bulls are encountering opposition at the downtrend line, yet an encouraging development is that they have managed to maintain the price above the 20-day EMA, which is at $1,107.
 Daily chart for MKR/USDT sourced from TradingView
Should the price rebound from its present position, it would imply a shift towards positive sentiment, with traders interpreting declines as attractive buying prospects. In such a scenario, the bulls are likely to make renewed attempts to propel the price to $1,370.
Conversely, if the price persists in its descent and breaches the 20-day EMA, it would indicate a determined defense of the downtrend line by the bears. This could lead the MKR/USDT pair to a decline, initially targeting the robust support at $980 and potentially extending the decline to $860.
 4-hour chart for MKR/USDT sourced from TradingView
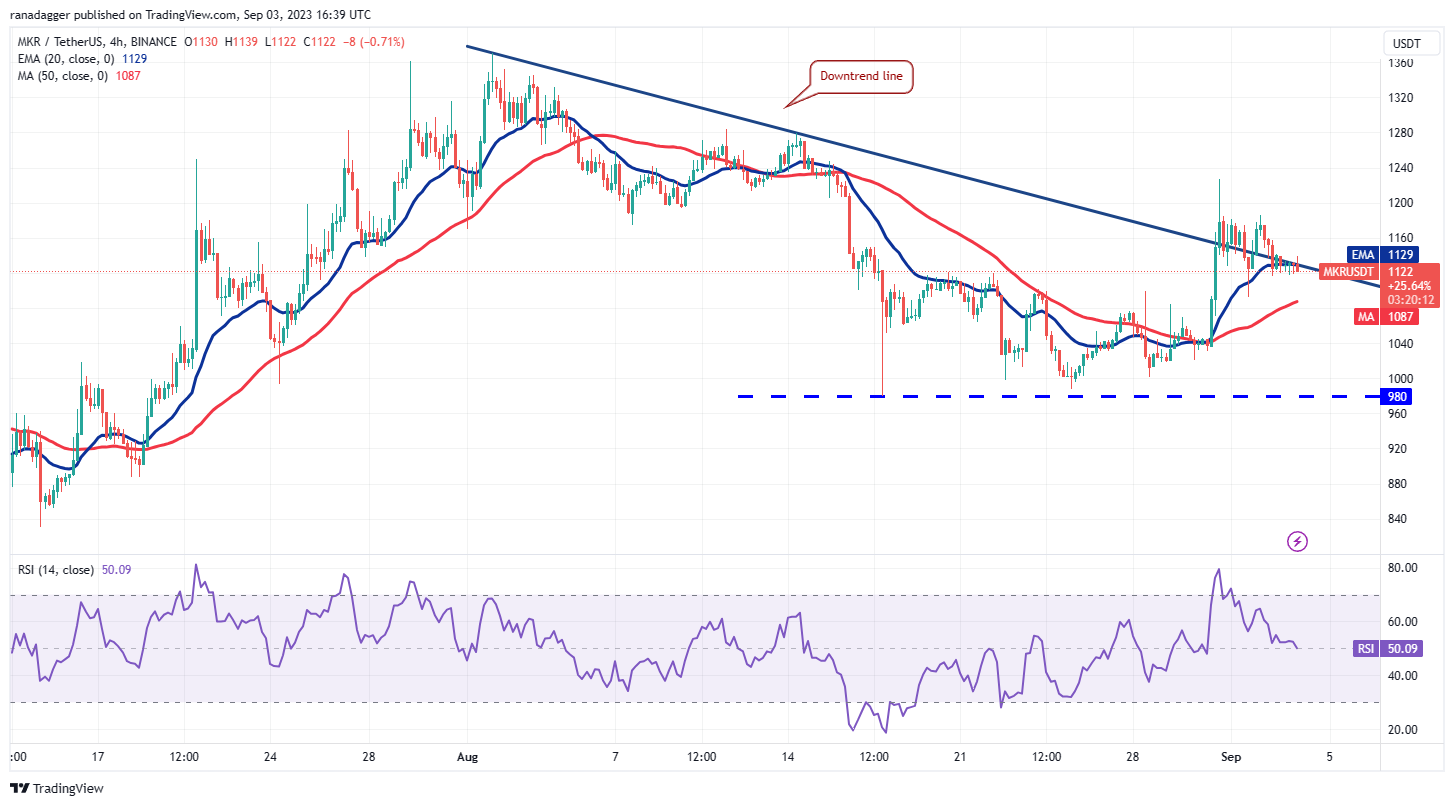
The 4-hour chart reveals that although the bulls managed to push the price above the downtrend line, their ability to maintain these higher levels is currently being challenged. This struggle suggests that the bears remain active, selling during upward movements.
Meanwhile, the 20-day EMA is becoming a battleground where bulls and bears are locked in a fierce struggle. If the price rebounds from this level, the bulls may make another attempt to break through the resistance barriers at $1,186 and subsequently at $1,227. A successful breach of this zone could potentially trigger a rally reaching as high as $1,280.
On the flip side, if the price remains below the 20-day EMA, it could potentially pave the way for a decline, with the next potential targets being the 50-day SMA and eventually $1,040.
Analysis of Tezos Price:
Tezos (XTZ), currently trading at $0.69, has been experiencing a battle for supremacy between bulls and bears around the substantial support level of $0.70. Notably, the inability of the bears to drive and maintain the price below this level signals a notable interest in buying at lower price points.
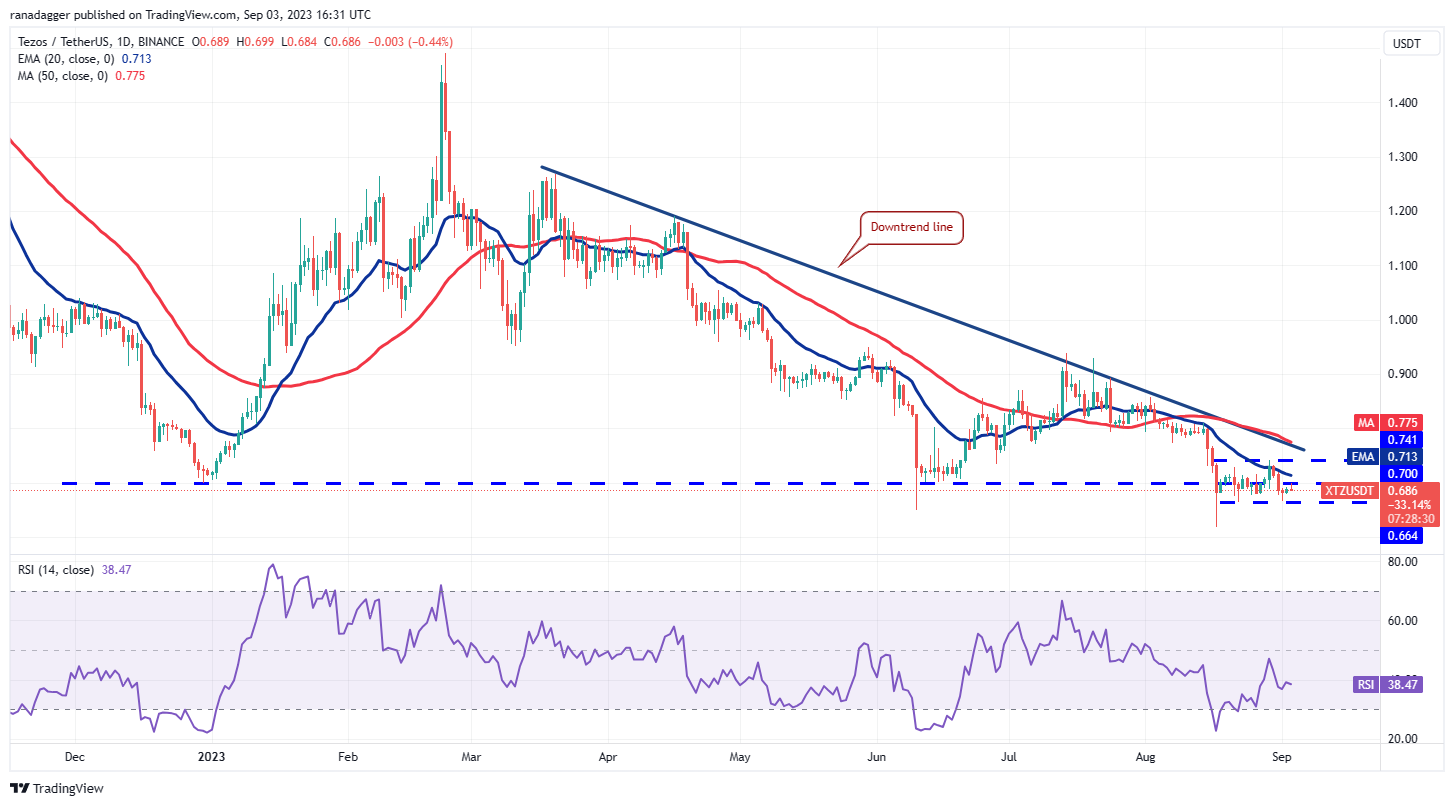 Daily chart for XTZ/USDT sourced from TradingView
The moving averages, which are currently slanting downward, appear to favor the bears. However, the RSI's upward trajectory suggests a gradual reduction in bearish momentum. The initial indication of strength would be a close above the 20-day EMA, situated at $0.71. This development could potentially open the path to a rally towards the downtrend line.
Although the downtrend line may pose a significant challenge, if the bulls manage to surmount it, the XTZ/USDT pair might embark on a fresh upward trajectory. This potential upswing could first target $0.94, followed by a subsequent aim at $1.04. It's worth noting that this optimistic outlook would be negated if the price declines and remains below $0.66.
 4-hour chart for XTZ/USDT sourced from TradingView
A closer examination of the four-hour chart reveals a consolidating pattern, with the price oscillating within the confines of $0.66 and $0.69. The intersecting moving averages, coupled with the RSI hovering just below the midpoint, indicate a tentative edge held by the bears. Sellers may be poised to test the resilience of the support level at $0.66, and should this level yield, it could serve as a launchpad for the next phase of the downtrend, with a possible destination at $0.61.
However, a different narrative would unfold should the price surge past $0.69. Such a move would signal robust buying interest at lower levels and could set the stage for a push towards the overhead resistance at $0.74. To confirm the commencement of a new upward trend, buyers would need to surmount the downtrend line.

Trending


Press Releases

Deep Dives