CryptoChronicle: Navigating Bitcoin's Price Odyssey in Uncharted Markets

Bitcoin, denoted by the ticker symbol BTC, experienced a downturn, reaching $37,218 and hovering around a significant threshold as Wall Street opened on November 16. This decline followed a mimicked price movement resembling BTC's attack on the $38,000 mark.
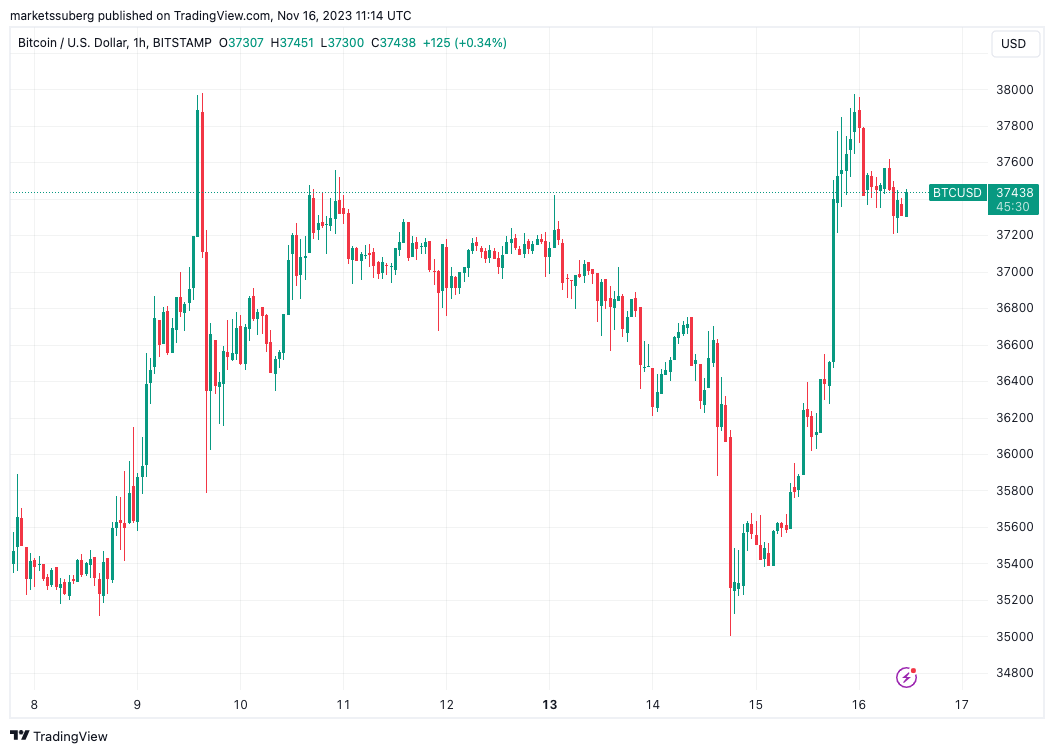 BTC/USD 1-hour chart. Source: TradingView
BTC reaches its highest point in 18 months
In a rapid reversal captured on the TradingView data, Bitcoin exhibited a pattern strikingly similar to the previous week, maintaining $38,000 as a robust resistance level. Currently valued at approximately $37,400, the BTC/USD pair was testing a crucial support zone, according to analysts.
$BTC 4H
— Skew Δ (@52kskew) November 16, 2023
price in area of interest now
bulls should pray here imo https://t.co/0wG1NhLJy2 pic.twitter.com/trnnG1hU0D
Material Indicators, a monitoring resource, signaled a potential long position through one of its proprietary trading indicators, emphasizing the importance of the current price zone in determining further upward momentum or potential invalidation.
Commentary on X (formerly Twitter) suggested that the rally might persist, with $40,000 becoming a focal point. However, reaching this target within the week was not guaranteed, and a dip below $35,375 would invalidate the #TradingSignals.
The initial upward movement coincided with a regulatory decision to delay the approval of various cryptocurrency exchange-traded funds (ETFs) in the United States. Despite ongoing speculation about a groundbreaking moment for Bitcoin, characterized by the introduction of the country's first Bitcoin spot price-based ETF, the delay maintained an atmosphere of uncertainty in the market.
Decent game theory take
— Skew Δ (@52kskew) November 15, 2023
it would make sense for spot ETFs to be approved first & a blend (Futures/Spot) to be more regulated/approved later on
all speculative though till which ever is approved first https://t.co/luQH6AUGRS
Open interest remains stable amid Bitcoin's resurgence in price
Notably, open interest remained steady during Bitcoin's price recovery, as highlighted by trader and analyst Daan Crypto Trades. He argued that the current market conditions, characterized by lower open interest and funding rates compared to the previous week's peaks, presented a more compelling case for sustained higher levels.
In summary, Bitcoin's recent price dynamics, influenced by regulatory decisions and market indicators, suggest a delicate balance between potential upward momentum and the need to maintain critical support zones.
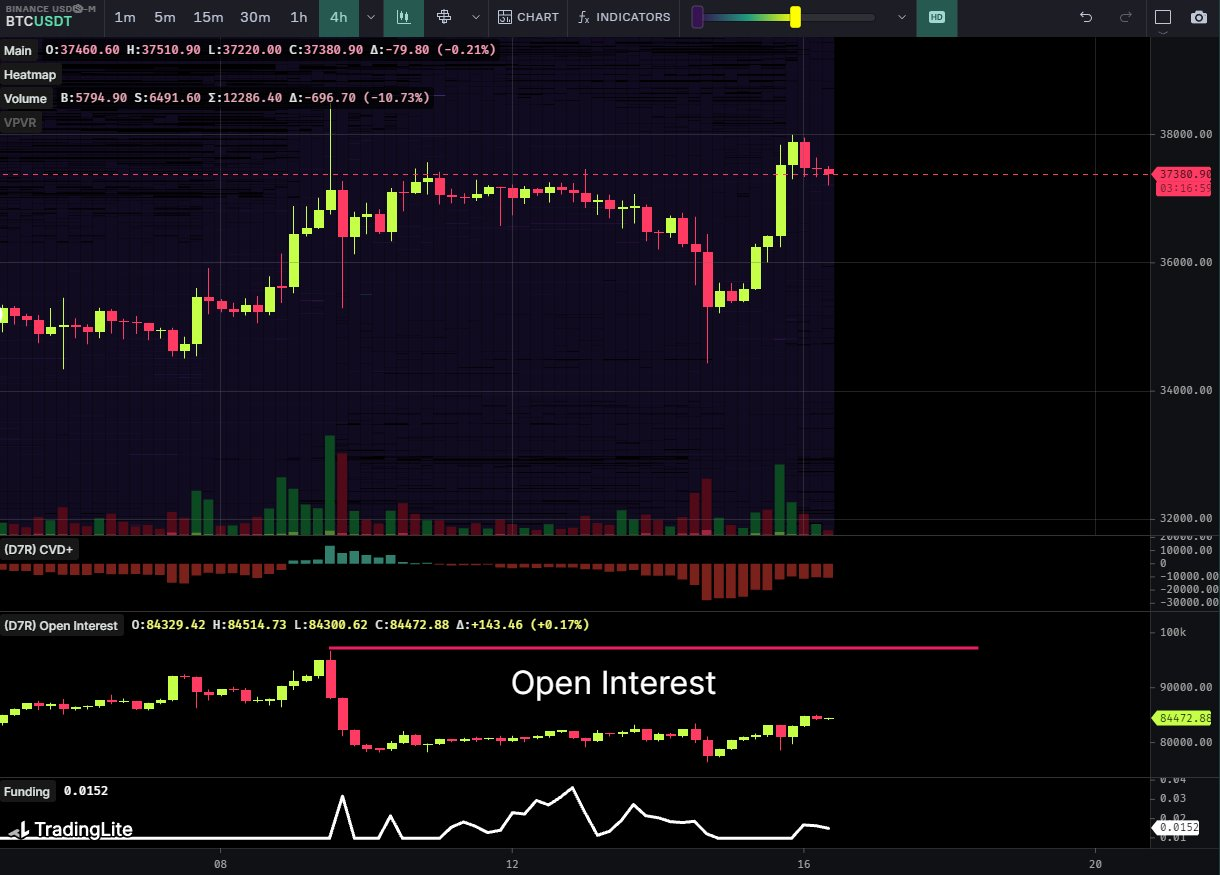 BTC/USD chart with OI, funding rates data. Source: Daan Crypto Trades/X
You might also like: CryptoHorizon Spectrum: BlackRock's ETF Symphony

Trending


Press Releases

Deep Dives


