- Home
- Cryptocurrency
- Crypto Quiescence: Unraveling Bitcoin and Ether's Tranquil Trends
Crypto Quiescence: Unraveling Bitcoin and Ether's Tranquil Trends

Bitcoin and Ether See a Slump in Trading Activity
Bitcoin (BTC) Market Overview:Price Takes a Dive, Landing at $26,351 Ether (ETH) Market Update: Price Experiences a Dip, Settling at $1,681
The cryptocurrency landscape has recently witnessed a notable ebb in trading momentum as the two major players, Bitcoin and Ether, grapple with the challenge of breaching their critical resistance thresholds – $30,000 for Bitcoin and $2,000 for Ether.
Fresh insights gleaned from crypto analytics firm Kaiko underscore the current climate, revealing that the 90-day volatility for BTC and ETH stands at 35% and 37% respectively. Interestingly, this places them in a realm of lower volatility compared to the oil market, which registers a 41% volatility rate. Such a decline in value momentum harkens back to a similar trend experienced in 2016.
 A Glimpse at 90-Day Price Volatility Trends Bitcoin, Ether, and Oil. Source: Kaiko
Visualizing the data above lends credence to the fact that the price fluctuations of BTC and ETH have receded significantly, marking a decrease of over fifty percent when contrasted with the same timeframe from the previous year. While August historically exudes a bullish sentiment within the cryptocurrency ecosystem, the diminishing oscillations in price are being met with optimism by numerous experts.
Of particular significance is the recent record-setting 90-day volatility dip, marking its lowest point in seven years. This phenomenon is mirrored by Bitcoin's daily volatility, which has now reached a five-year nadir.
 Historic Lull in Daily Volatility for Bitcoin. Source: TradingView
Prominent Bitcoin technical analyst, going by the moniker "CryptoCon" on social media platforms, has taken to the X platform to share insightful observations regarding the present decrease in Bitcoin's price volatility. More intriguingly, they delve into the typical trajectory that follows periods of subdued volatility.
The analyst discerns a parallel between the ongoing scenario and the low volatility period observed in 2020, a precursor to a robust bullish surge. However, their analysis is underpinned by a word of caution against an extended phase of lateral movement, a phenomenon that has the potential to impact the foremost cryptocurrency.
#Bitcoin volatility continues to decrease, which I've shown is bullish
— CryptoCon (@CryptoCon_) August 16, 2023
But the burning question is, when does the sideways grind end?
Upon thinking about I was reminded of a time very similar to now… pic.twitter.com/psO50vxUWD
Upon scrutinizing historical data, the analyst uncovers an interesting pattern: after a significant Black Swan event in 2020, which saw Bitcoin plummet by over fifty percent in a single day, the ensuing month witnessed a remarkable recovery. Intriguingly, as Bitcoin ventured close to the $10,000 mark, its momentum fizzled out, ushering in a prolonged era of diminished volatility. Following this phase, characterized by three months of subdued price oscillations, the cryptocurrency surged to new heights, breaking resistance barriers, before reverting to a phase of lateral movement.
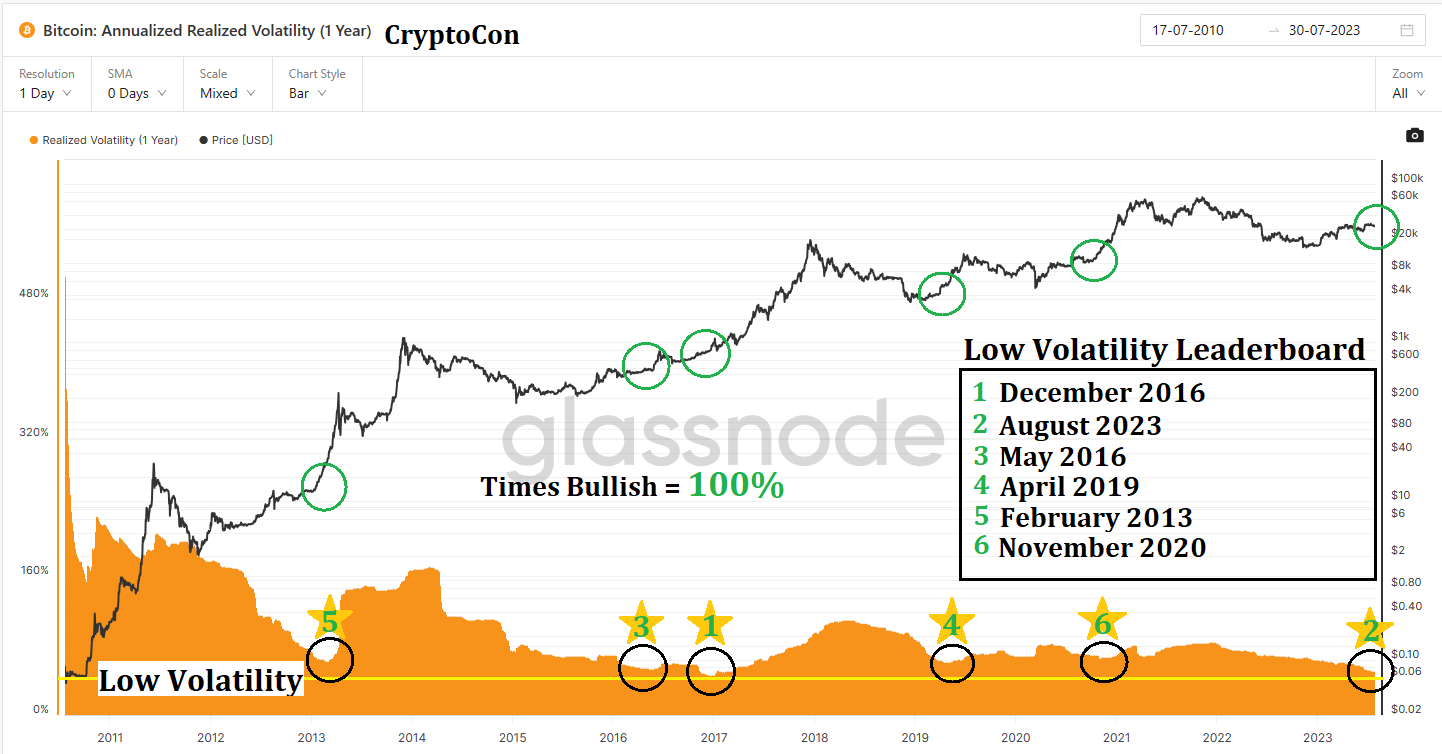 Analyzing the Trajectory of Bitcoin's Price After Periods of Low Volatility. Source: X In summation, the analyst underscores Bitcoin's propensity to surge following periods marked by low volatility, a pattern manifested through the establishment of an initial high, succeeded by a second pinnacle, culminating in a third peak against a pivotal resistance point. CryptoCon contends that this historical trend heralds a major price movement following each substantial low volatility period in the Bitcoin realm.

Trending


Press Releases

Deep Dives


