- Home
- Cryptocurrency
- Crypto Downtrend and Market Dynamics: A Snapshot
Crypto Downtrend and Market Dynamics: A Snapshot

Fluctuations in the cryptocurrency market's price trajectories persisted on August 19, while the collective market capitalization struggled to maintain its foothold above the $1 trillion mark.
Bitcoin (BTC), often abbreviated as "BTC," saw its trading indicators falter, settling at a value of $26,144—a level that proved elusive as the market transitioned into the weekend.
Foremost in the market's descent were the prominent losses incurred by Bitcoin, the pivotal digital asset that governs nearly half of the entire cryptocurrency domain. This descent reached its zenith on August 17, catalyzed by various factors, including news of Elon Musk's SpaceX reportedly divesting its Bitcoin holdings, along with other significant events.
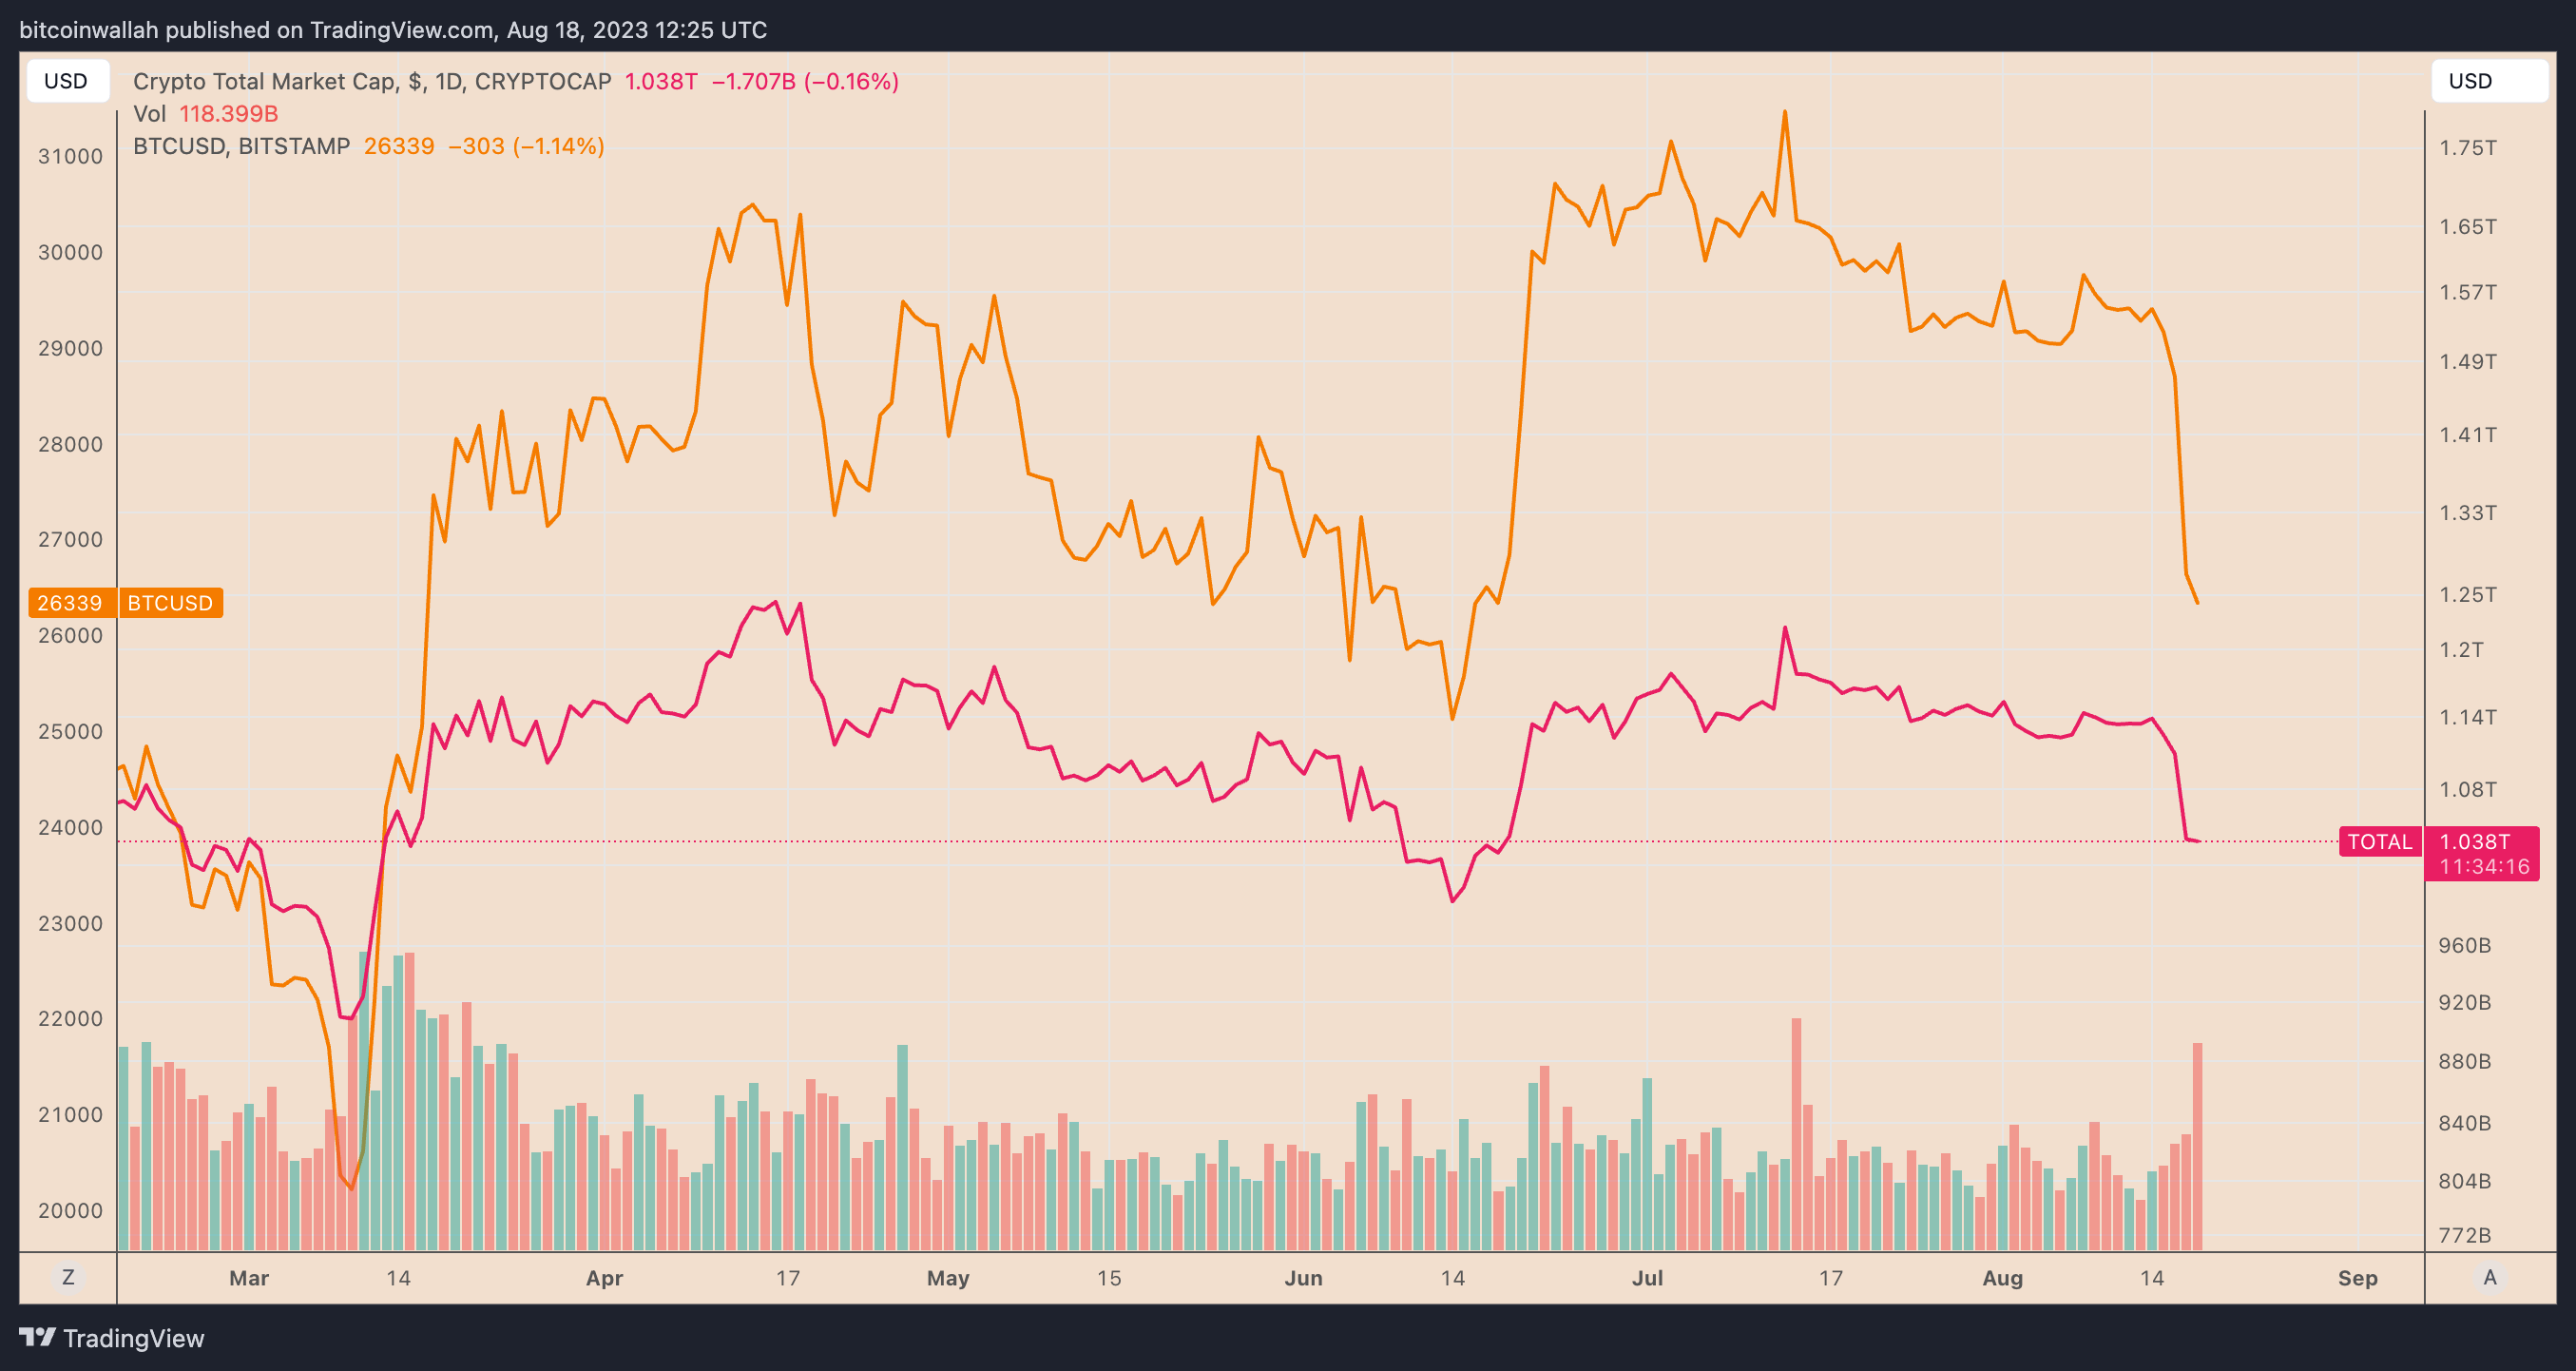 Comparison of Cryptocurrency Market and Daily BTC/USD Performance Graph, Derived from TradingView Data.
As the SpaceX announcement reverberated, Bitcoin bore the brunt of the fallout, a decline exacerbated by a veritable "bloodbath" of forced liquidations seen throughout the crypto derivatives sector. This maelstrom prompted an approximate total of 176,300 traders to unwind contracts valued at $1.04 billion, with the majority, approximately 80%, attributed to long positions. These forced exits, in essence, compelled traders to sell at a loss in a bid to mitigate potential further losses.
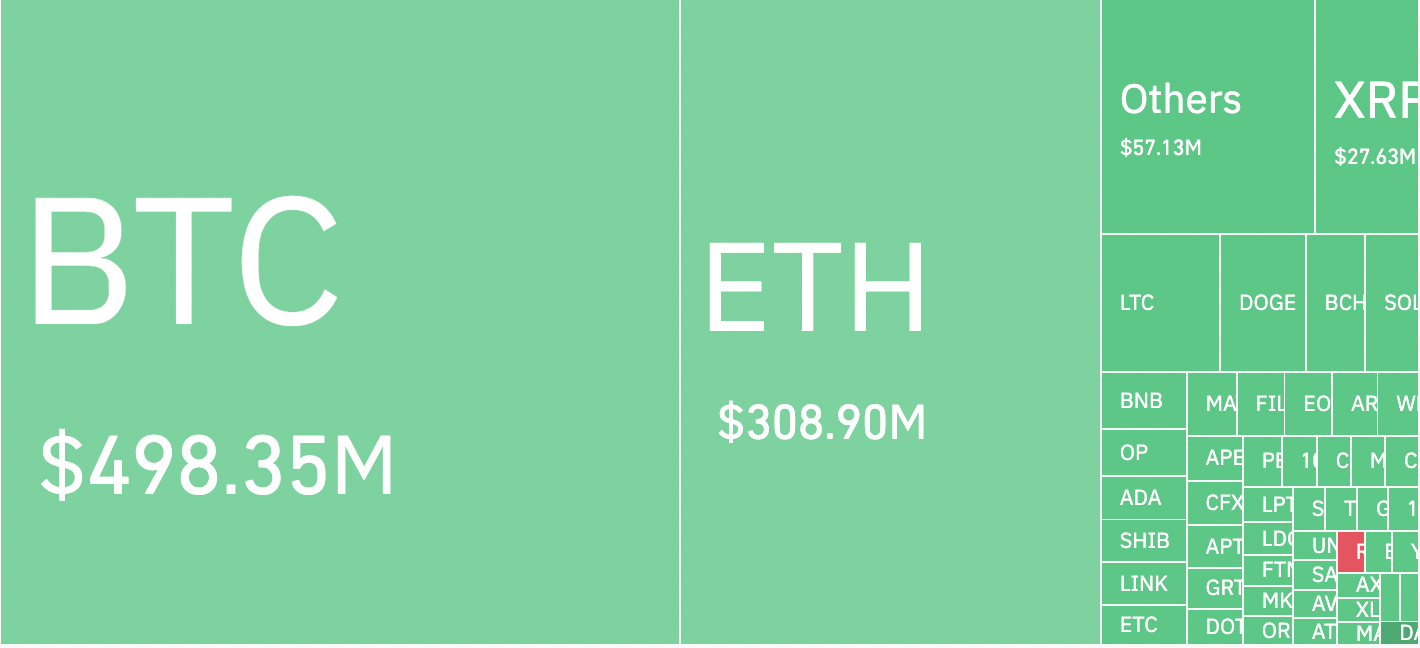 Bitcoin faced the highest number of liquidations compared to other cryptocurrencies in the market. Information sourced from CoinGlass.
In a parallel trajectory, macroeconomic risks exerted downward pressure on the cryptocurrency sphere, mirroring concurrent losses within the global equities market. Evidently, the MSCI World Index—a composite index comprising significant stocks from twenty-three developed economies—endured a stark decline on August 17. This coincided with escalating apprehensions regarding China's economic landscape and the specter of elevated interest rates.
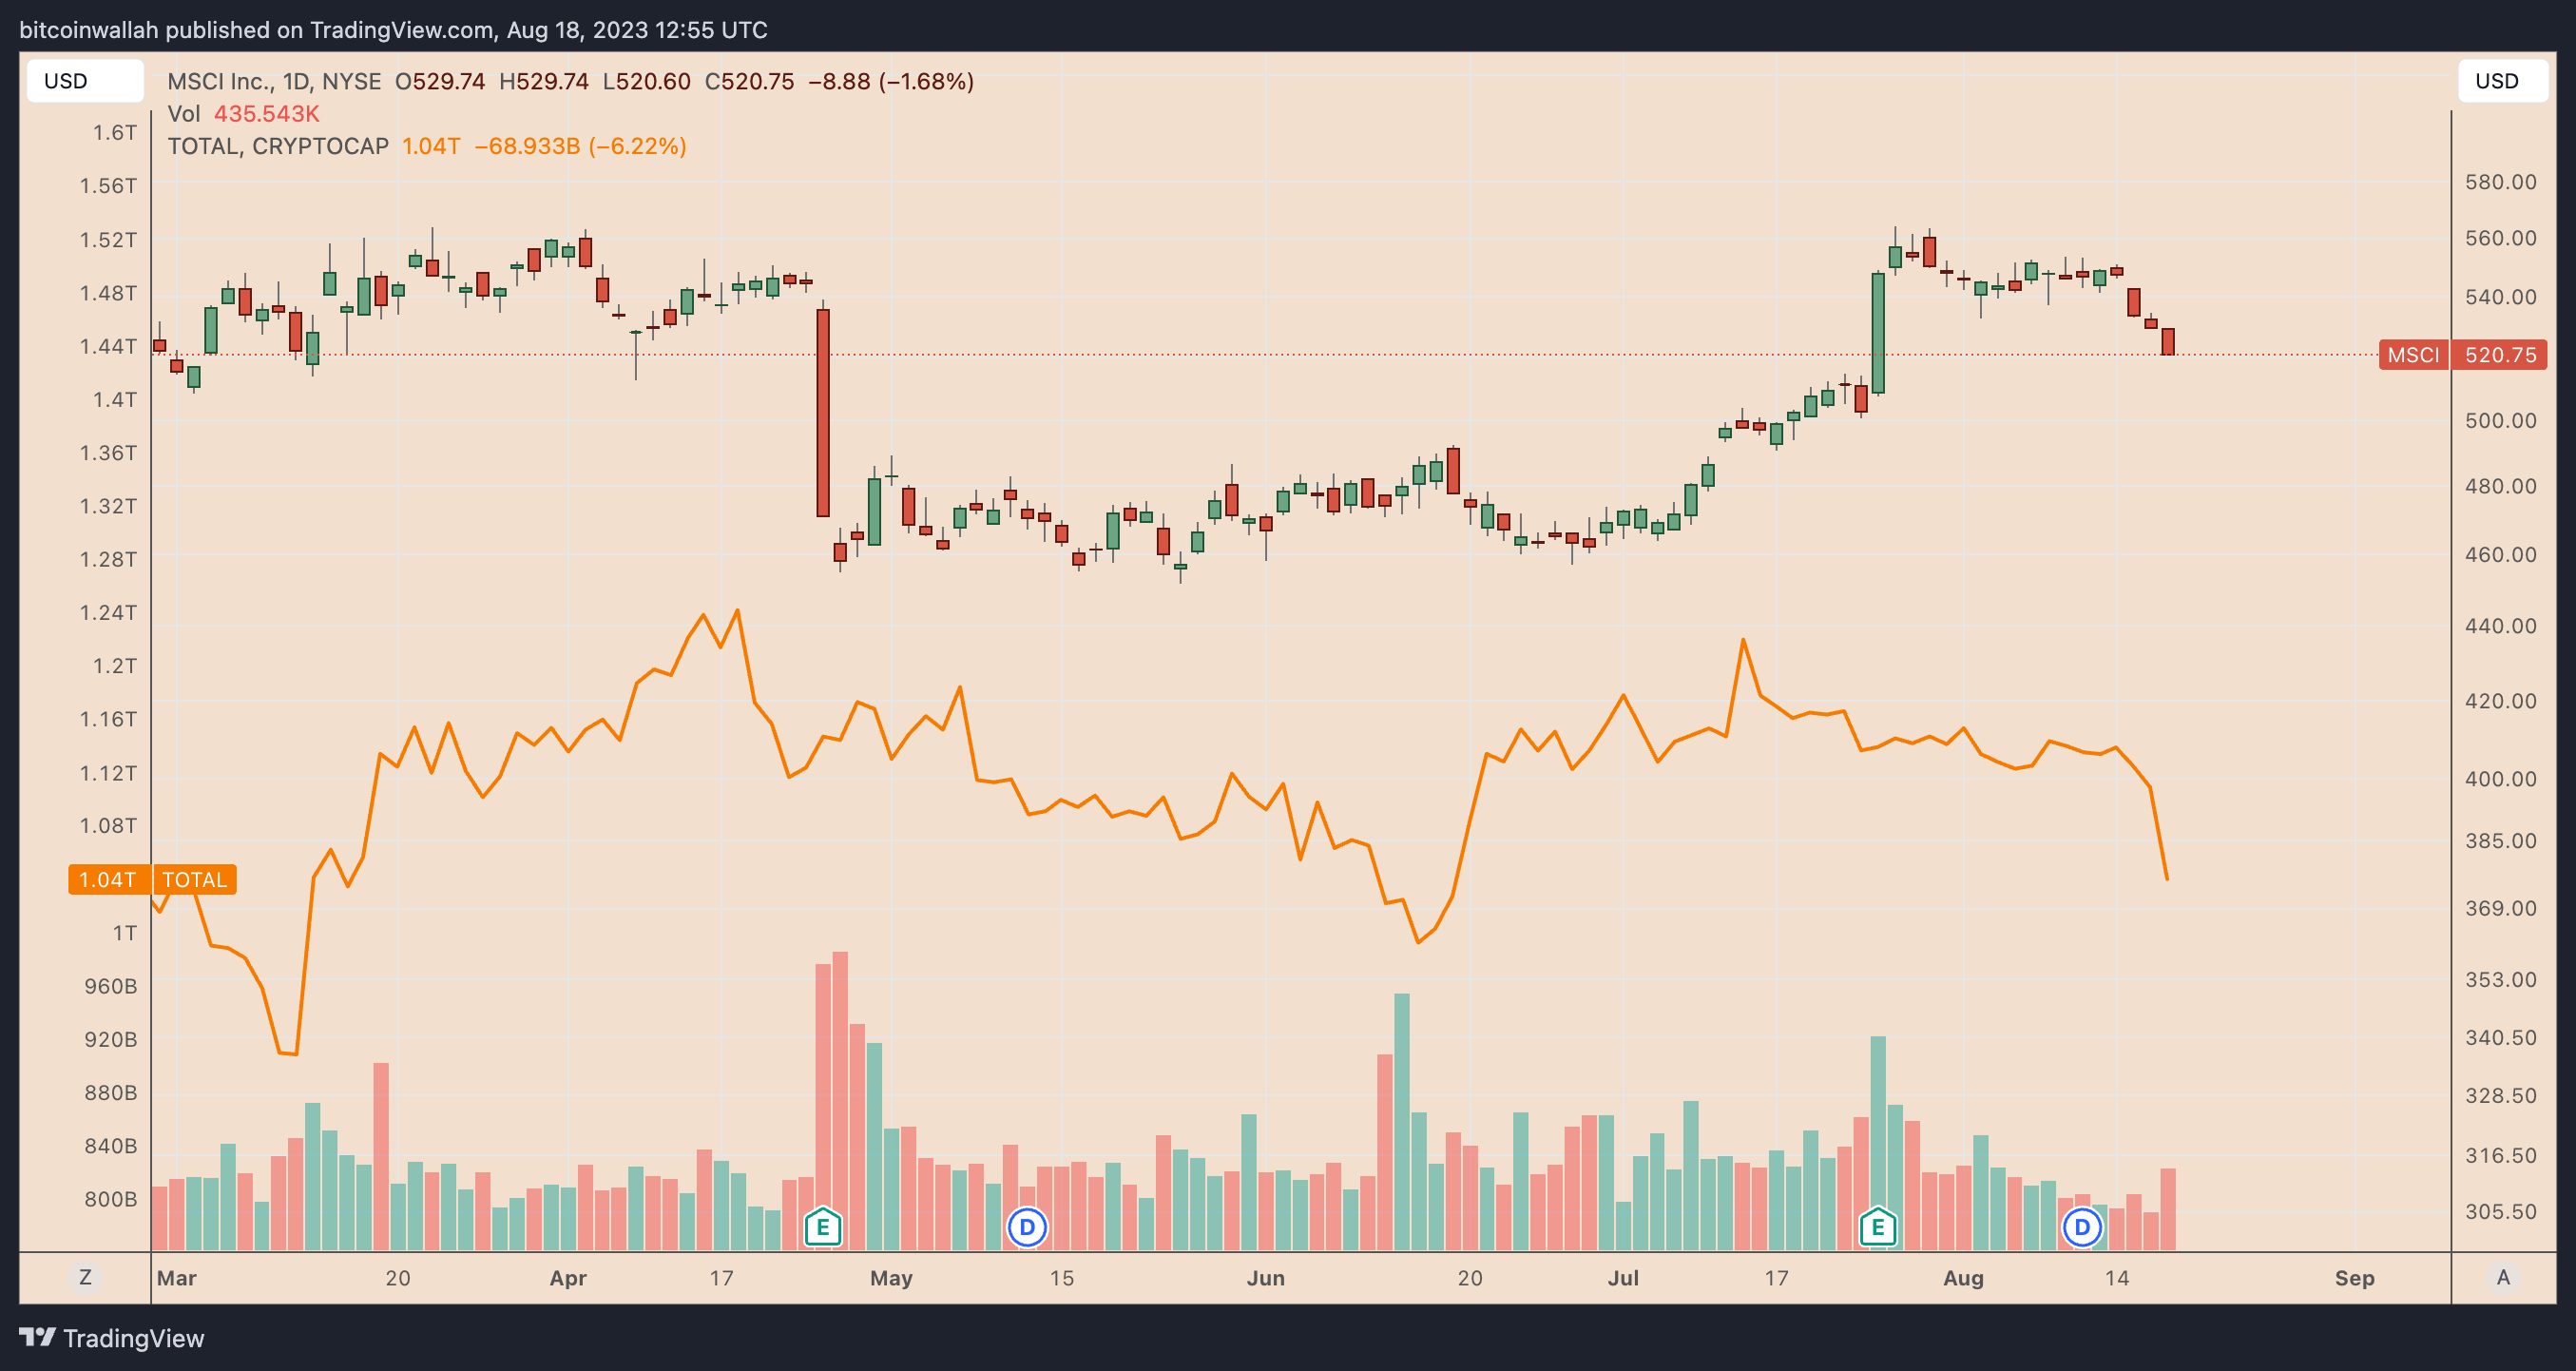 Comparison of Daily Performance Chart: MSCI vs. Cryptocurrency Market, Data Derived from TradingView Source.
The contraction experienced in China's economic landscape engendered anxieties of a potential depreciation of the yuan to stimulate economic growth—a scenario that could potentially cast a shadow on the cryptocurrency realm, particularly in the short term. A historical precedent, as observed in August 2015, revealed that the previous devaluation of the yuan corresponded with a 23% downturn in BTC's value over the ensuing fortnight, while the wider cryptocurrency market shed 27% in tandem.
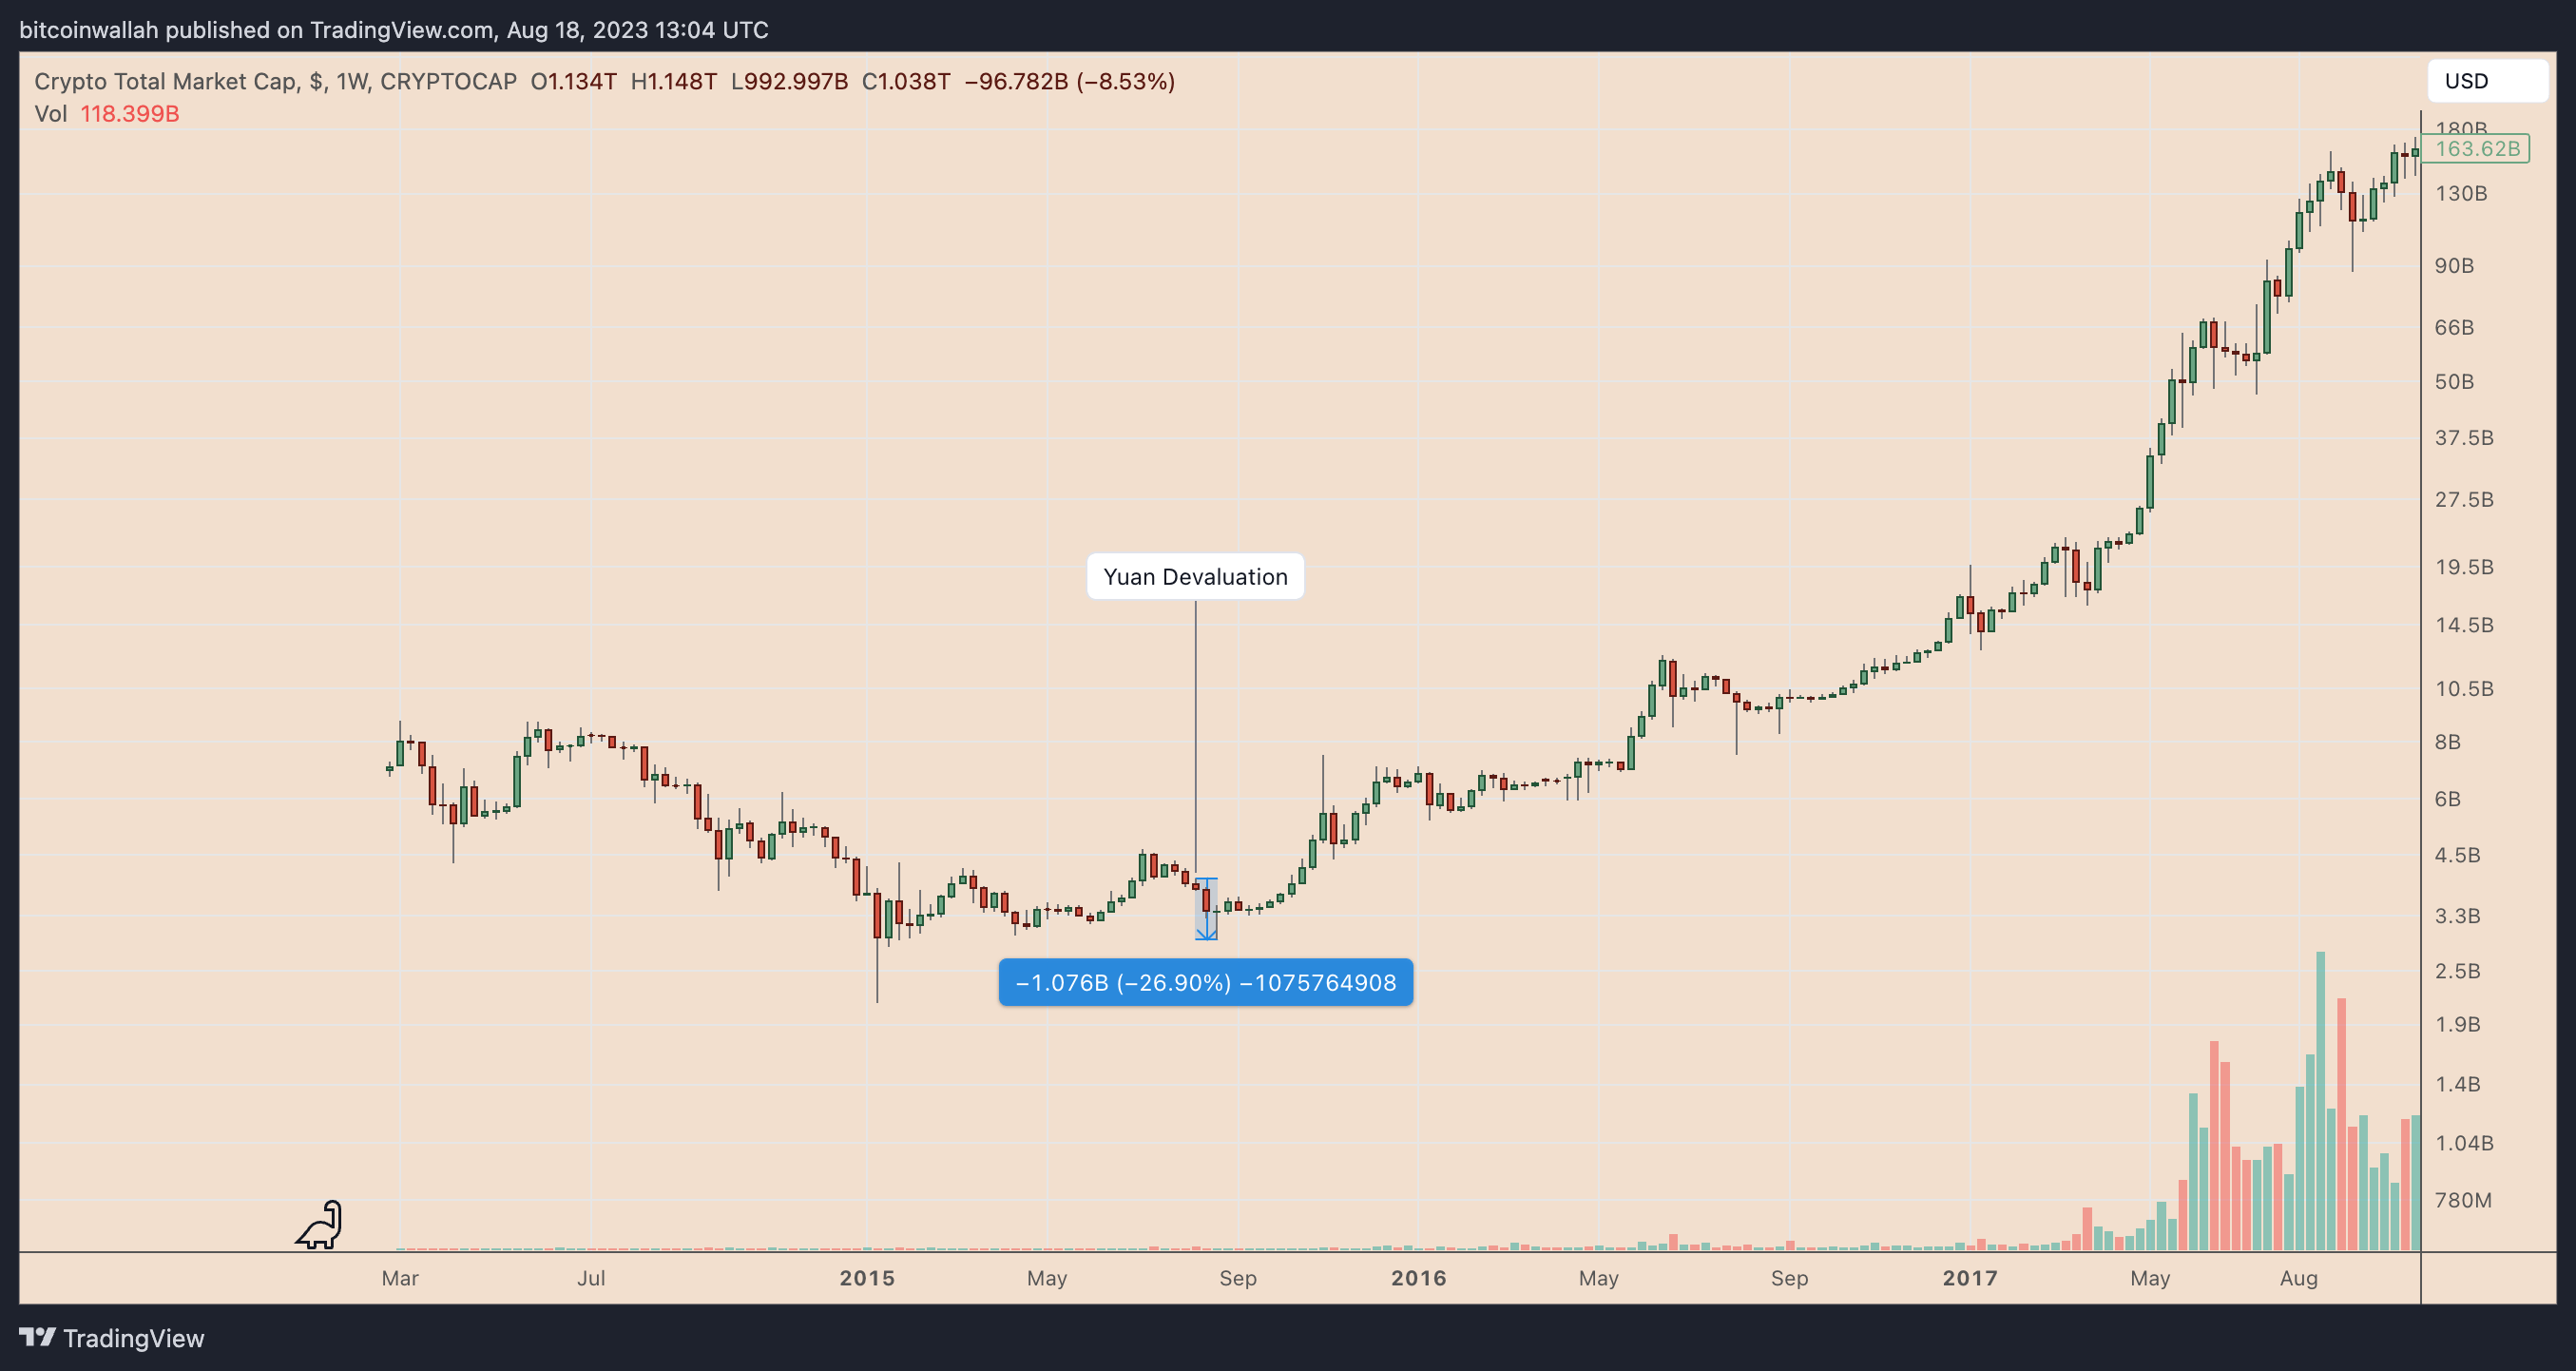 Daily performance chart of the cryptocurrency market. Data source: TradingView.
Adding to the narrative, the technical indicators within the cryptocurrency market painted an equally somber picture. Presently, the ongoing downward trajectory exhibits characteristics akin to a prospective "head-and-shoulders" pattern on the weekly chart, fueling apprehensions of further depreciation throughout 2023.
The "head-and-shoulders" (H&S) formation embodies a bearish reversal signal, typically culminating in a downward breach beneath its supporting threshold, commonly referred to as the neckline. As of August 18, the cryptocurrency market tested the H&S neckline, signaling a potential descent in motion.
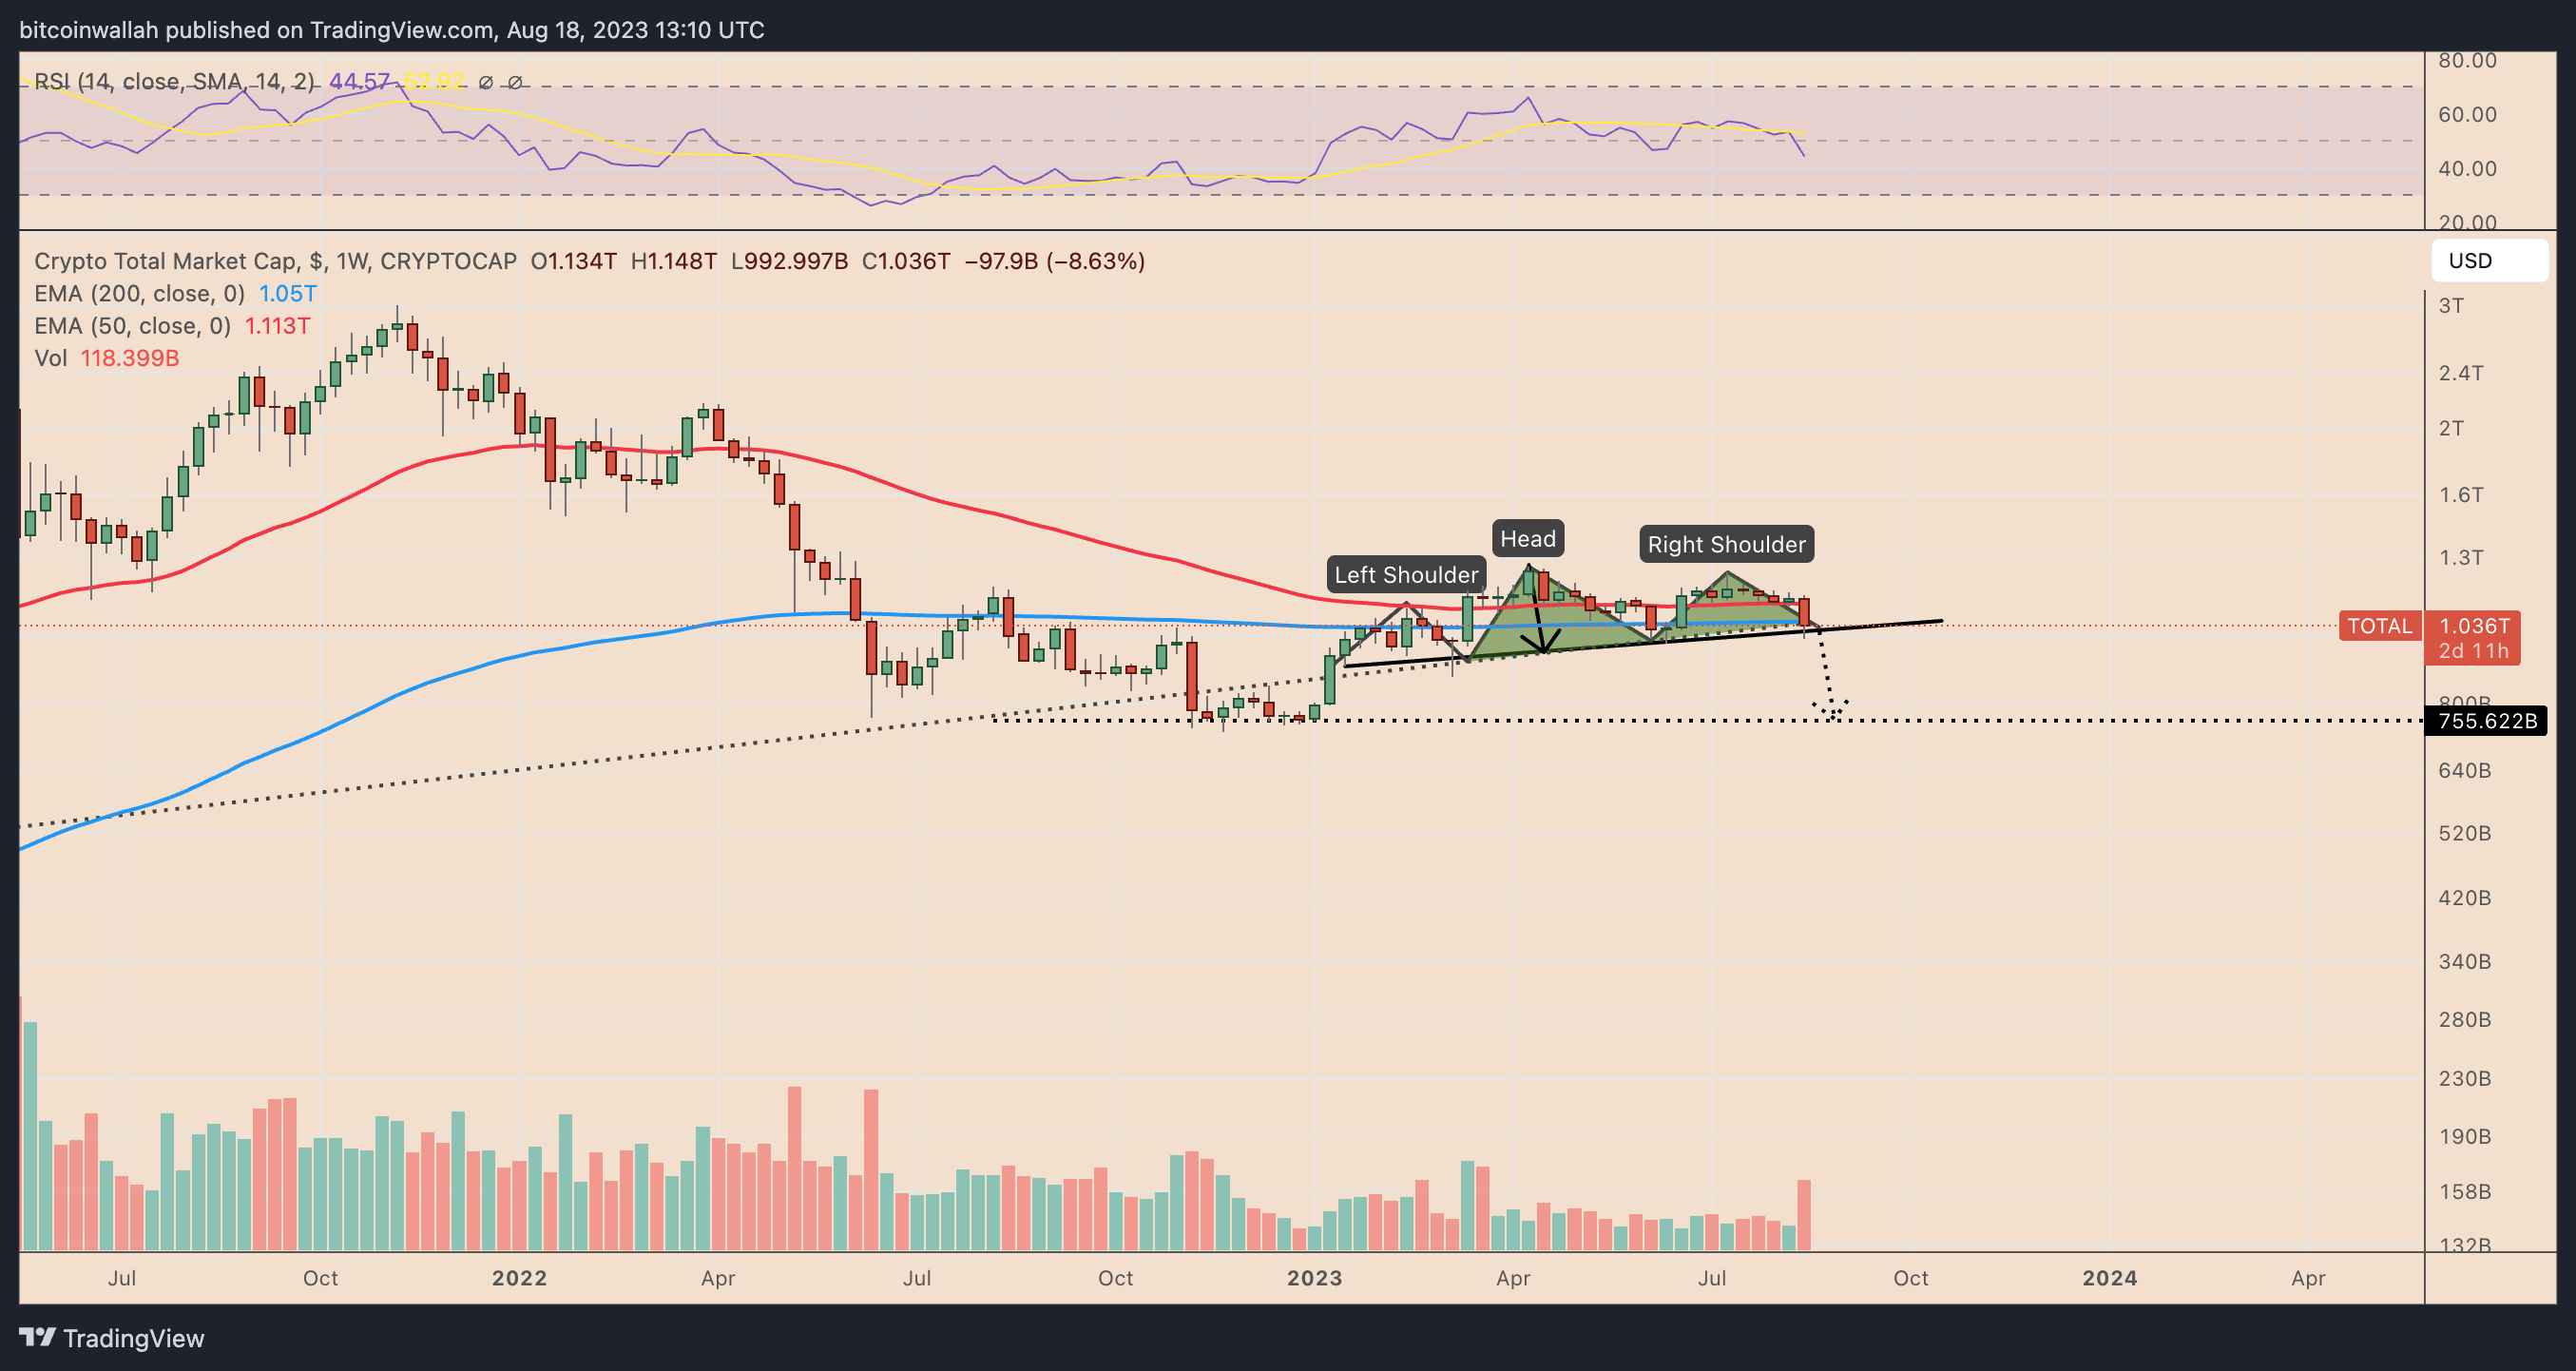 Weekly performance chart depicting the cryptocurrency market. Data source: TradingView.
Should this pattern fully manifest, the projected nadir for the culmination of 2023 or early 2024 could settle around $751 billion, signifying a decline surpassing 25% from the present valuation. Conversely, proponents of market recovery—the "bulls"—will endeavor to engineer an ascension towards the 50-week exponential moving average (50-week EMA), represented by the red curve, nearing the $1.113 trillion mark in 2023.
Of pivotal significance is the imperative of sustaining the pivotal 200-week EMA (denoted by the blue curve) at approximately $1.08 trillion, as this level functions as a cornerstone of support for the bullish sentiment, ushering the market forward.

Trending


Press Releases

Deep Dives


