Crypto Charts Unveiled

The Daily Chart
Taking a leisurely stroll through the daily timeframe, we witnessed a valiant attempt to breach the critical $1,750 level, akin to a daring expedition into the unknown. However, much like a ship battling treacherous waters, Ethereum's price faltered and met with stern resistance, causing it to tumble rather unceremoniously below this pivotal threshold. Should ETH decide to chart a course southward and breach the seemingly fragile short-term support at $1,650, we may find ourselves on a journey to a more profound abyss, specifically the $1,400 region.
Furthermore, the 50-day and 200-day moving averages, those reliable indicators reminiscent of ocean currents, are poised to embark on a bearish crossover, with the sprightly 50-day setting sail beneath the seasoned 200-day (a phenomenon often referred to as the "Death Cross"). This occurrence, much like a foreboding storm on the horizon, bears ill omens and may herald the initiation of another somber bearish phase, casting shadows on our mid-term outlook.

The 4-Hour Chart
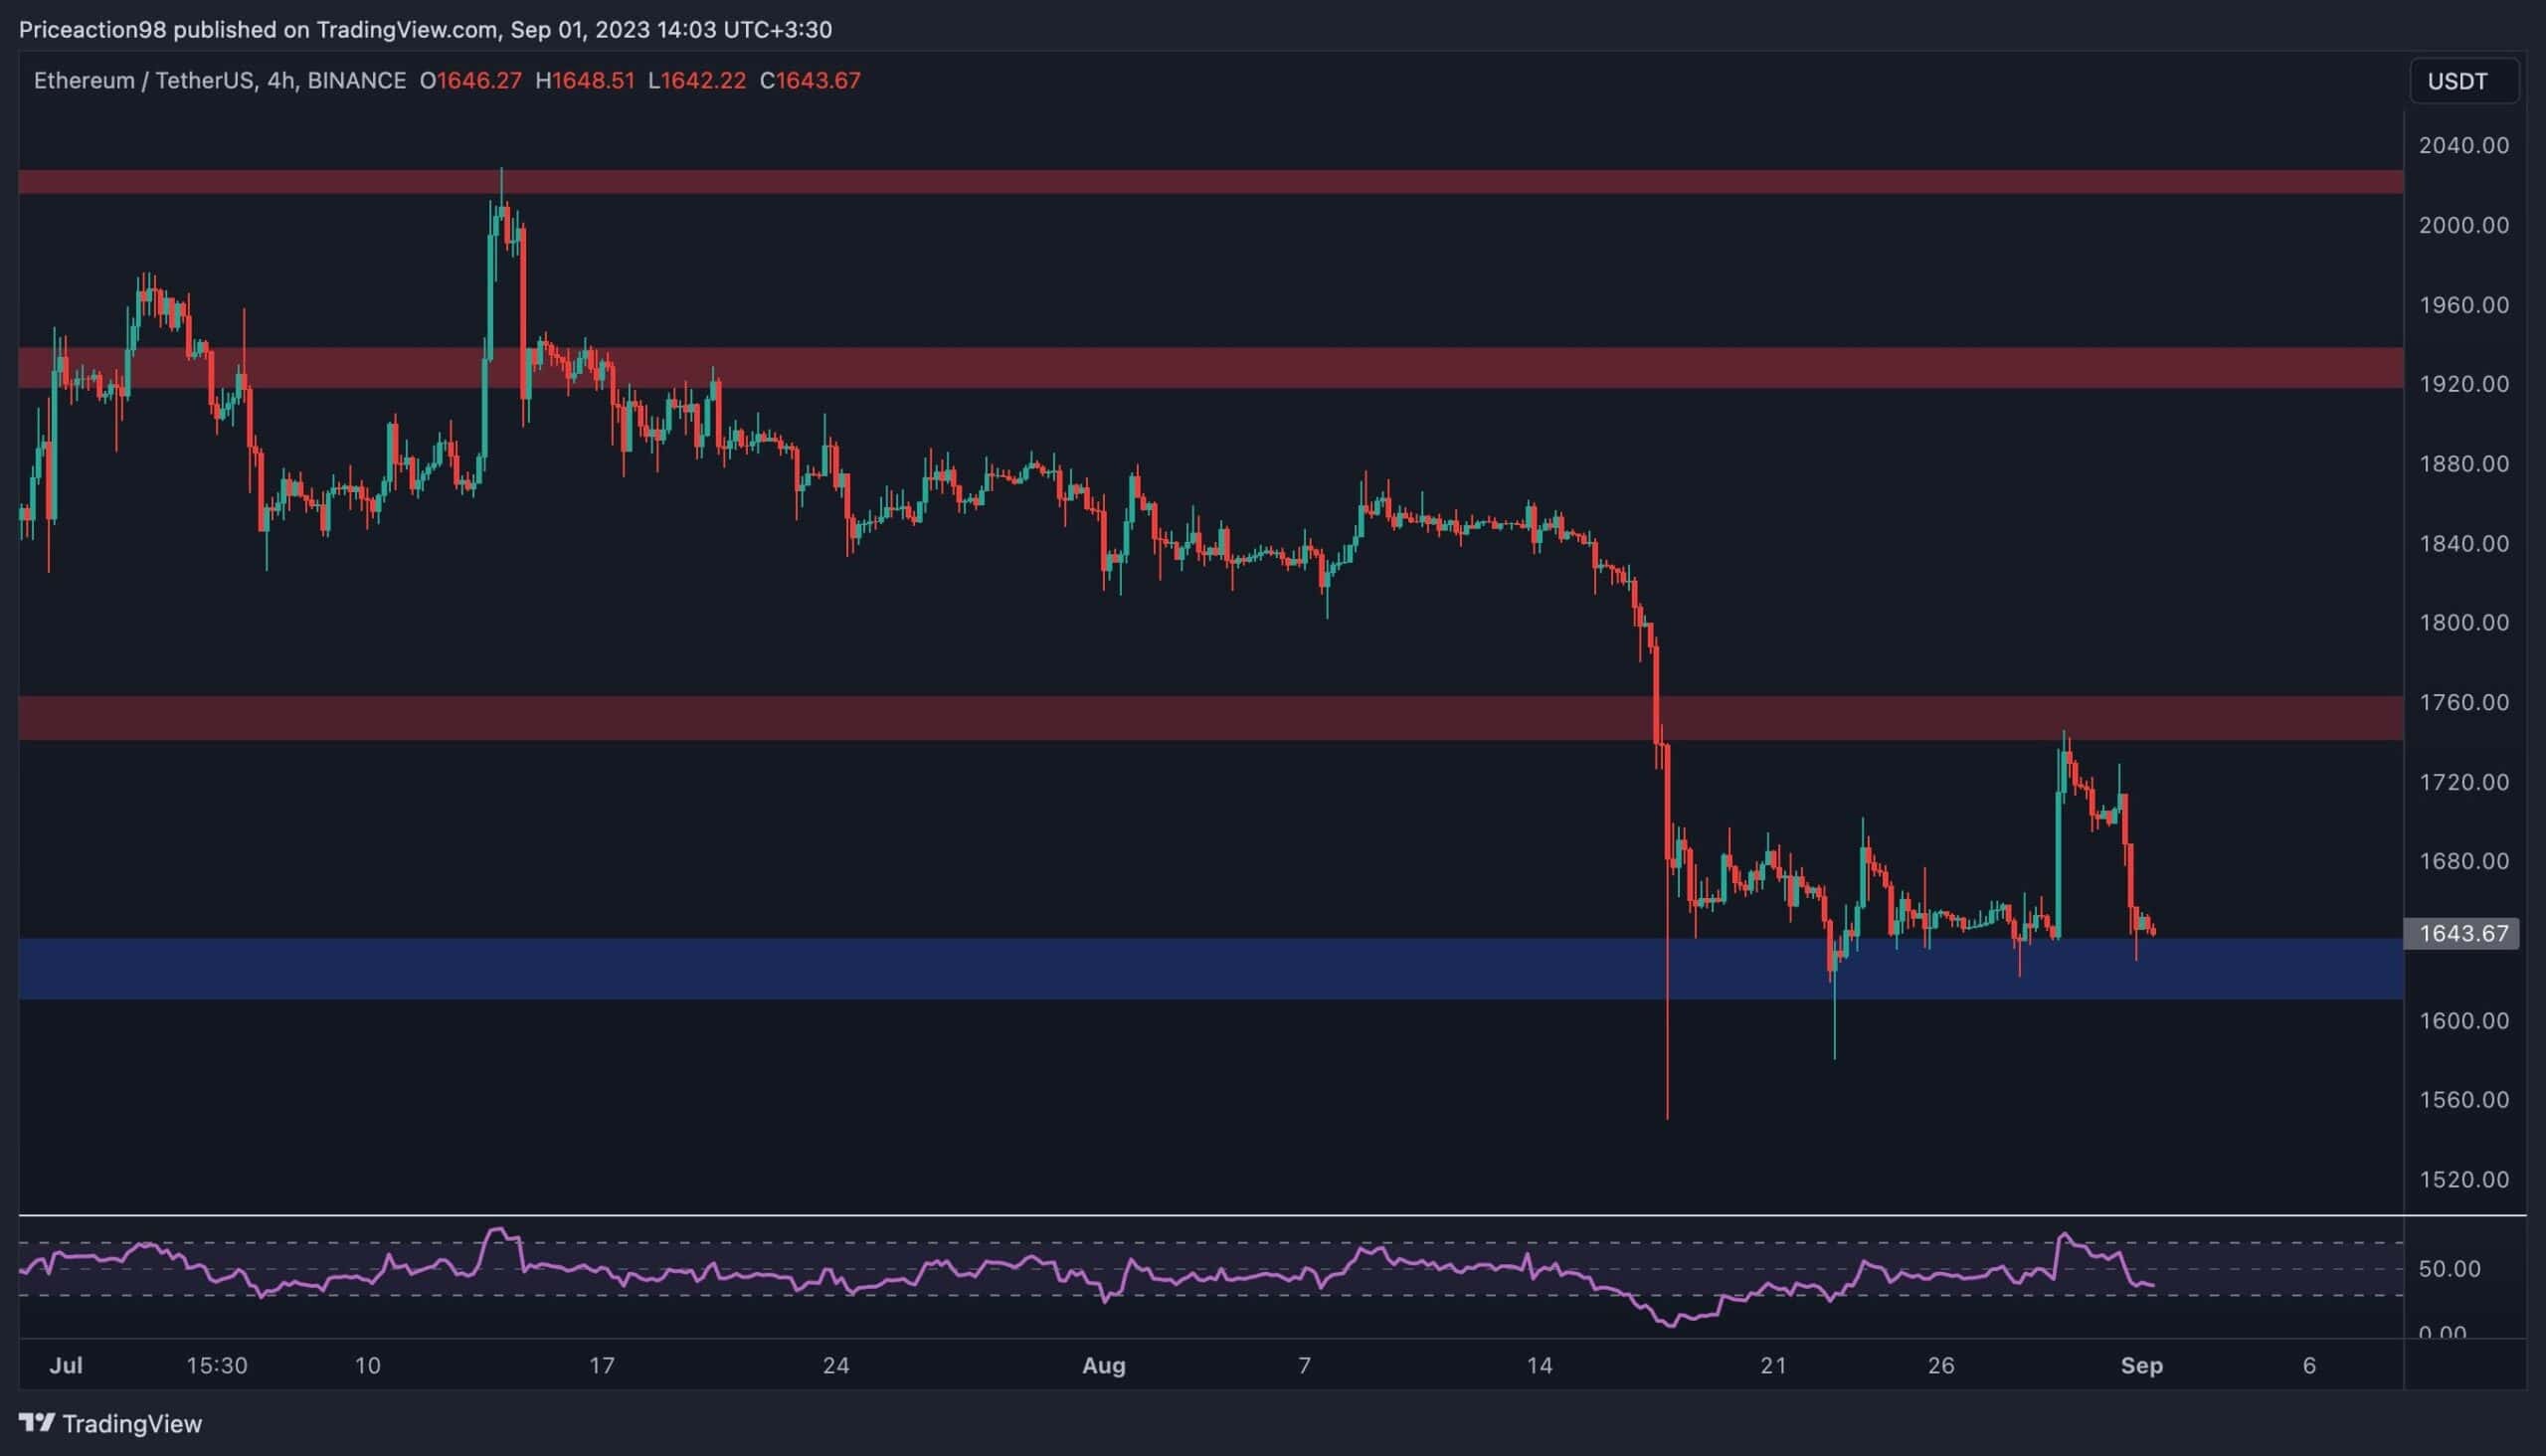
Turning our attention to the 4-hour timeframe, it becomes readily apparent that the resistance bastion at $1,750, like an impregnable fortress, vehemently repelled Ethereum's advances, casting it adrift towards the seemingly steadfast $1,650 support level. The market, akin to a wary traveler, has yet to reveal its intentions for a potential revival from this support bastion, as it valiantly attempts to breach the barricades.
Meanwhile, the RSI indicator, our trusty compass in these turbulent waters, has plunged beneath the 50% threshold, signaling a shift in the tides, where the bears now seem to have wrested control of the ship's wheel. Consequently, unless ETH can muster the strength to hoist its sails and maintain its course above the $1,650 mark, swiftly reclaiming the coveted $1,750 territory, we may find ourselves charting a course toward further uncharted depths.
Ethereum Taker Buy Sell Ratio
Following weeks of drifting in a seemingly placid trading range, Ethereum's price has recently undergone a substantial descent, akin to a mysterious journey into the abyss. Analyzing metrics from the futures market can be akin to deciphering ancient maritime charts, offering us insights into the possible destinations on this voyage.
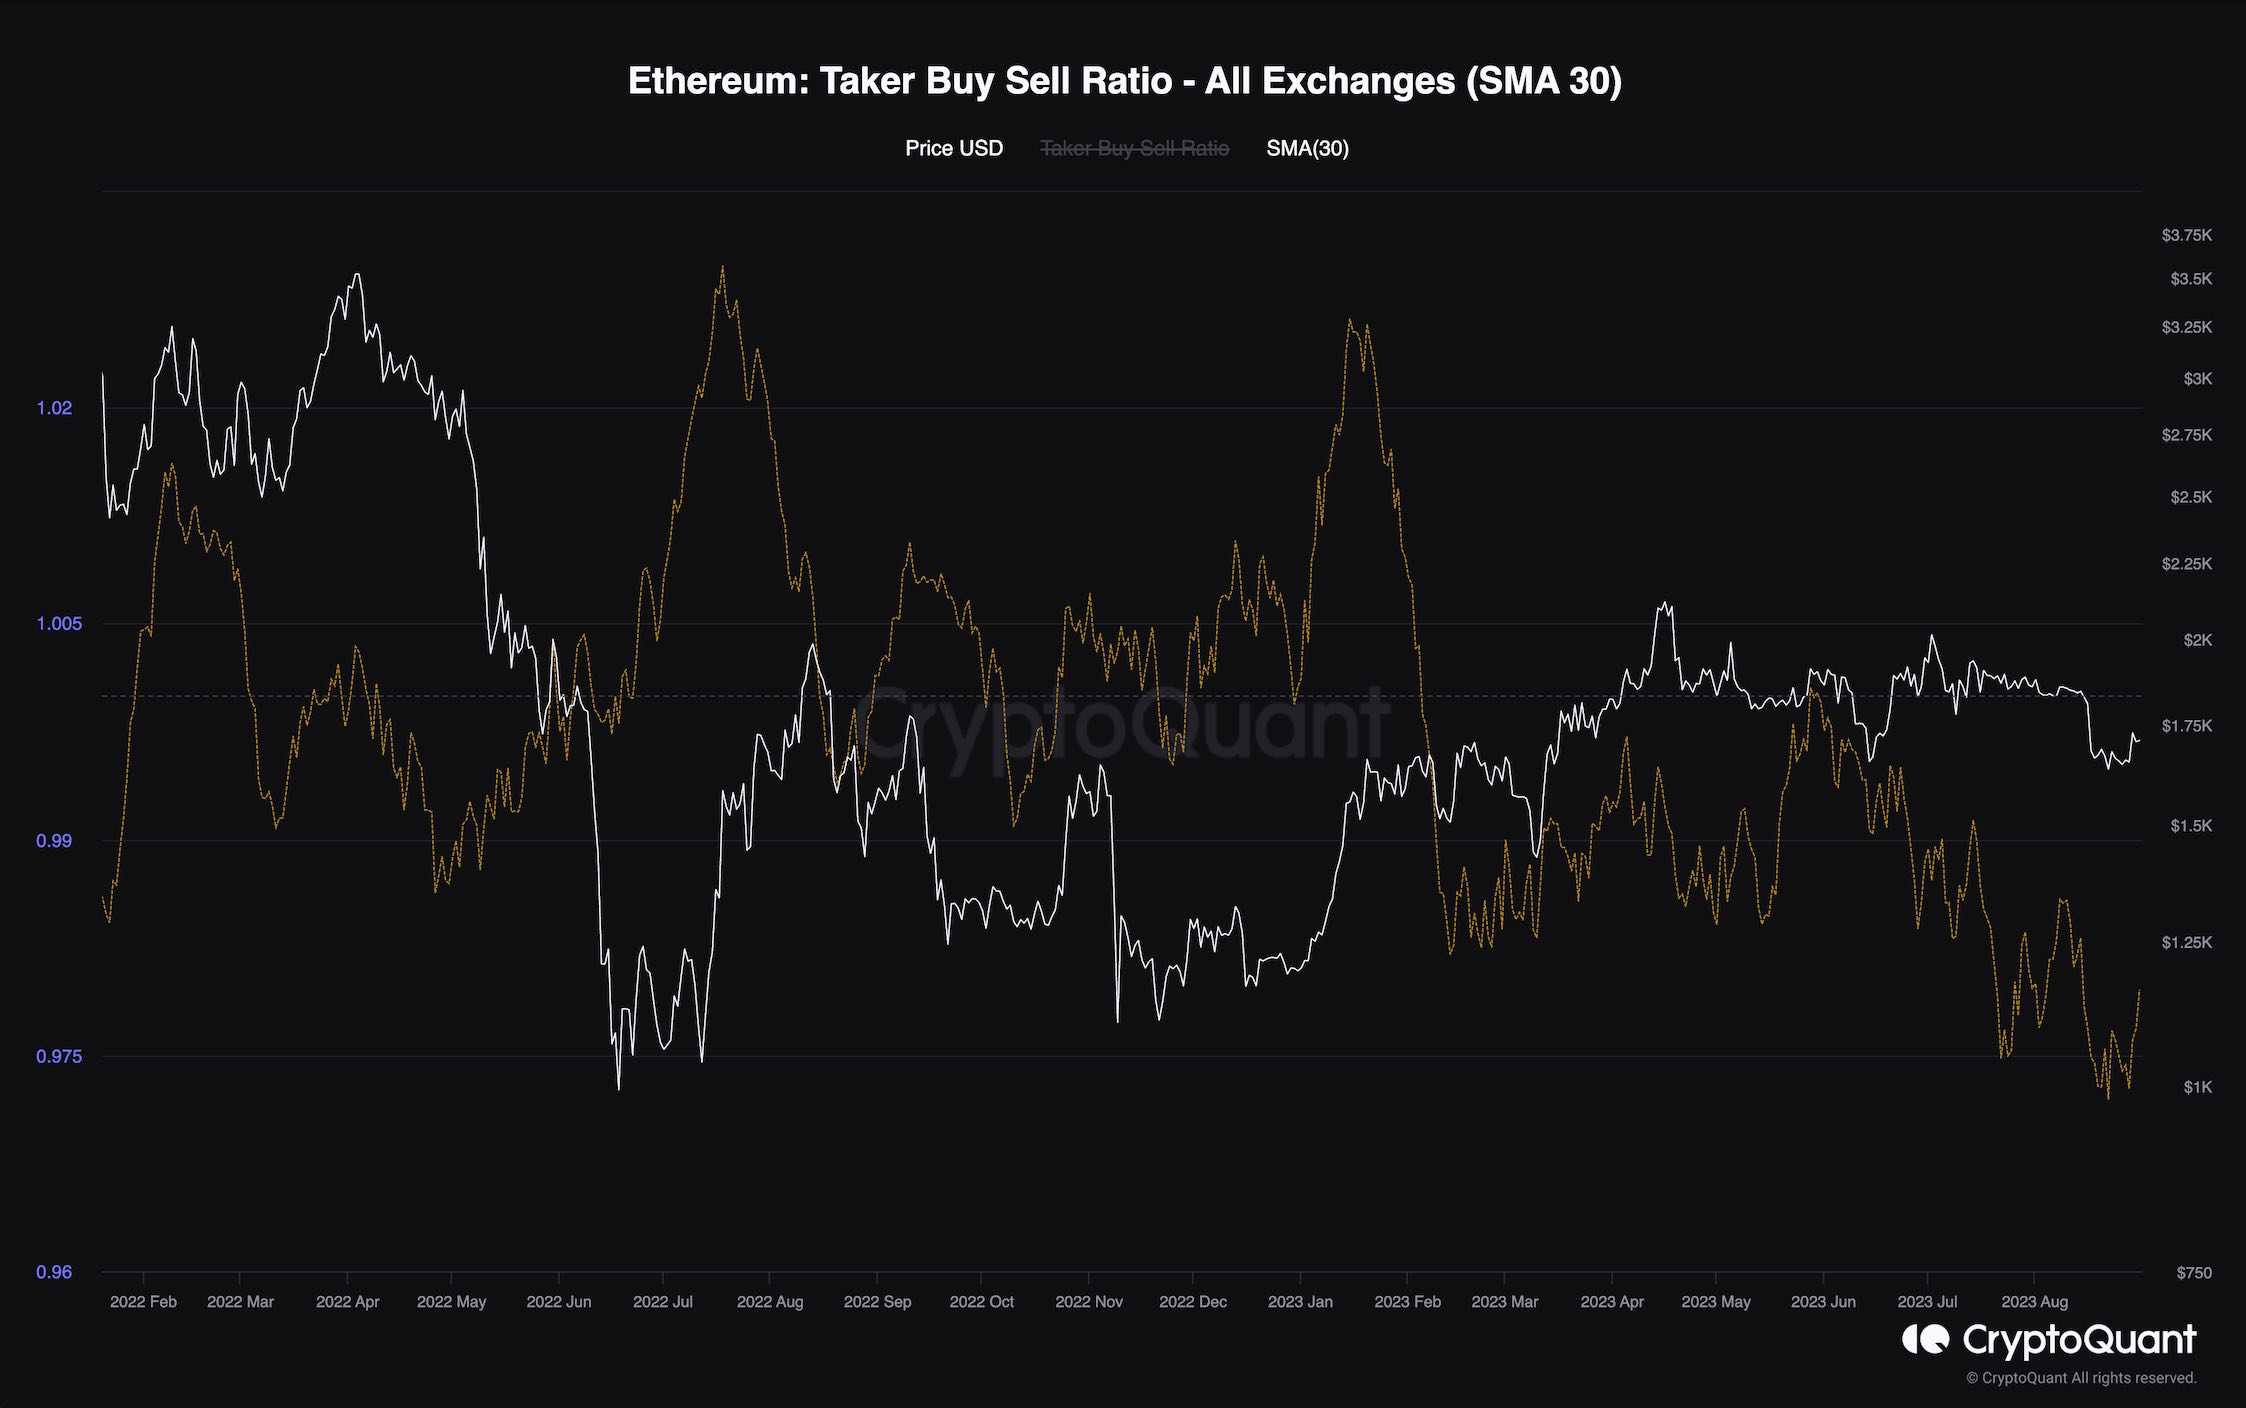
This chart presents the 30-day standard moving average of the taker buy-sell ratio metric, which serves as our trusty lantern in these dark waters, illuminating whether buyers or sellers are executing their orders with fervor. Values that boldly exceed one are akin to spotting a lighthouse in the distance, signaling a bullish outlook, while values clinging closely to one are akin to navigating treacherous waters filled with lurking bears.
As the chart vividly illustrates, the taker buy-sell ratio has embarked on a gradual descent over the past few months, steadily plunging to depths beyond one. As long as this nautical trend persists, it casts a shadow of doubt on the horizon, suggesting a continued bearish trajectory. To raise our hopes for a newfound impulsive uptrend, future traders must cast their anchors aside and embrace a more aggressive buying strategy, as indicated by the metric bravely surpassing the one threshold once more.

Trending


Press Releases

Deep Dives


