BTC Stagnation: On-chain Insights

Bitcoin's Symbol, BTC Ticker Update Price Dips to $26,047. Recent data indicates that on-chain activity for Bitcoin has reached levels reminiscent of the period before its surge to an all-time high in 2021.
Ki Young Ju, the CEO of the analytics platform CryptoQuant, shared insights in a recent post on X (formerly known as Twitter) on August 25th, revealing that Bitcoin velocity has hit multiyear lows.
Bitcoin's Value Stagnates at $26,000
Bitcoin's value has been relatively stagnant at its current price point. The absence of a clear trend in BTC's price over the past months has led to a reduced motivation for buying or selling.
This unchanging state is underscored by the concept of velocity, which measures the movement of BTC units across the network.
Based on CryptoQuant's analysis, the velocity metric on daily timeframes is now comparable to levels observed in October 2020.
Ki offered insights into this situation, saying, "There are two ways to interpret this scenario."
"It can be viewed positively as it signifies that whales are holding onto their positions. Conversely, it could be seen negatively as there is a lack of transfer to new investors."
 Chart depicting Bitcoin velocity, sourced from CryptoQuant.
Ki also noted a similar lack of significant trading activity among high-volume investors. This contributes to the narrative that the market is currently adopting a "wait and see" approach towards BTC.
Persistent "Oversold" RSI Signal
The volume data carries additional significance for another reason.
In late 2020, during a phase of long-term bottoming, the rebound in this metric coincided with Bitcoin's initial surge past the $20,000 mark, ultimately reaching new all-time highs a year later.
However, the current scenario differs. Bitcoin is now generally considered oversold at its present value of $26,000, as indicated by its daily relative strength index (RSI) measured by TradingView.
As previously reported, the 12-hour RSI reached its lowest point in five years earlier this month and has yet to recover. This once again highlights the anticipation for renewed investor interest that has yet to manifest.
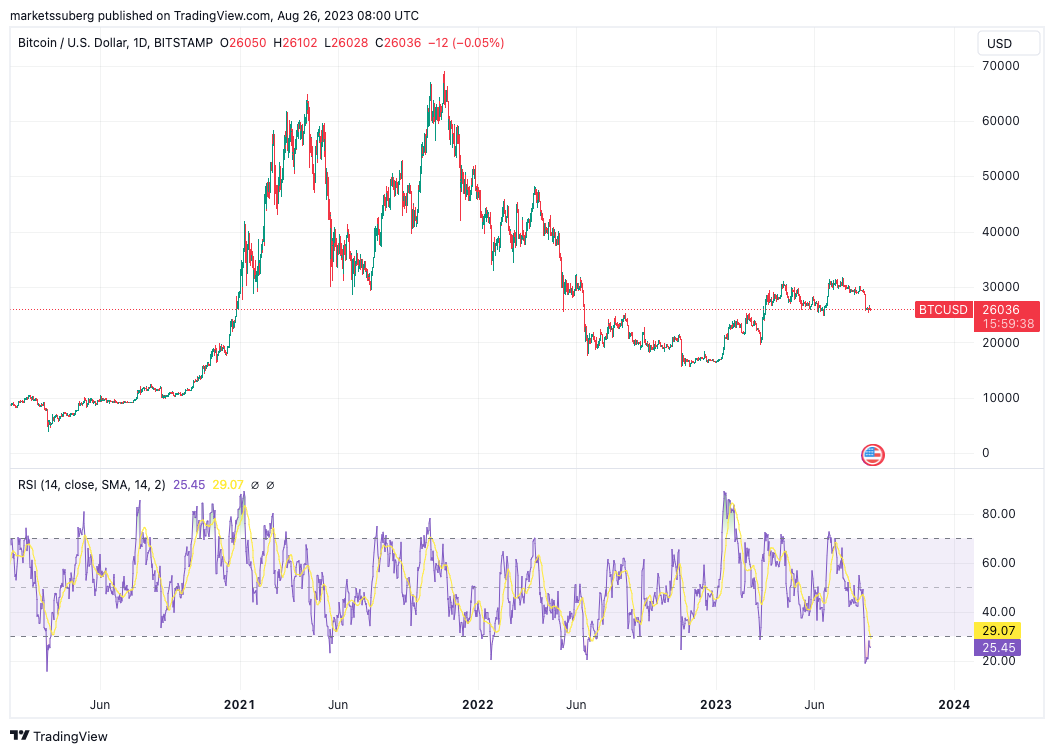 One-day BTC/USD chart featuring RSI, obtained from TradingView.

Trending


Press Releases

Deep Dives


