Bitcoin's Price and the Dollar's Dance

Bitcoin (BTC) experienced a noticeable downturn to $26,208, closely embracing a crucial long-term trendline on September 7. This occurred amid the backdrop of the U.S. dollar flexing its muscles and reaching its highest point in the past six months.
 One-hour chart for the BTC/USD pair sourced from TradingView
The relationship between Bitcoin and the 200-week moving average poses a significant and pivotal question
Within the ever-evolving narrative surrounding Bitcoin, the spotlight inevitably falls on its intricate dance with the 200-week moving average. Based on data from TradingView, the price fluctuations of BTC remained firmly centered around the approximate $25,700 range.
It's worth noting that market conditions appeared somewhat less tumultuous compared to the preceding day. In a rollercoaster-like fashion, Bitcoin's value swung from $26,000 to local lows, dipping below $25,400 within a mere hour.
In an atmosphere characterized by cautious optimism, Bitcoin traders remained apprehensive, with growing concerns of potential future declines.
#Bitcoin Open Interest ramping up yet again.
— Daan Crypto Trades (@DaanCrypto) September 7, 2023
Looks to be setting up for another wick to take out some positions soon. Looks to mainly be shorts chasing price here at the last bit. pic.twitter.com/lr3VYtxu7F
On September 7, a well-known trader, TraderSZ, candidly shared his insights with his followers on X (formerly Twitter), stating, "$BTC - unless we manage to regain the May low, my conviction remains that we're heading in a downward trajectory." He went on to mention that he had taken a conservative short position, setting his sights on $23.6k, but remained open to revising his strategy if Bitcoin managed to recapture the May low.
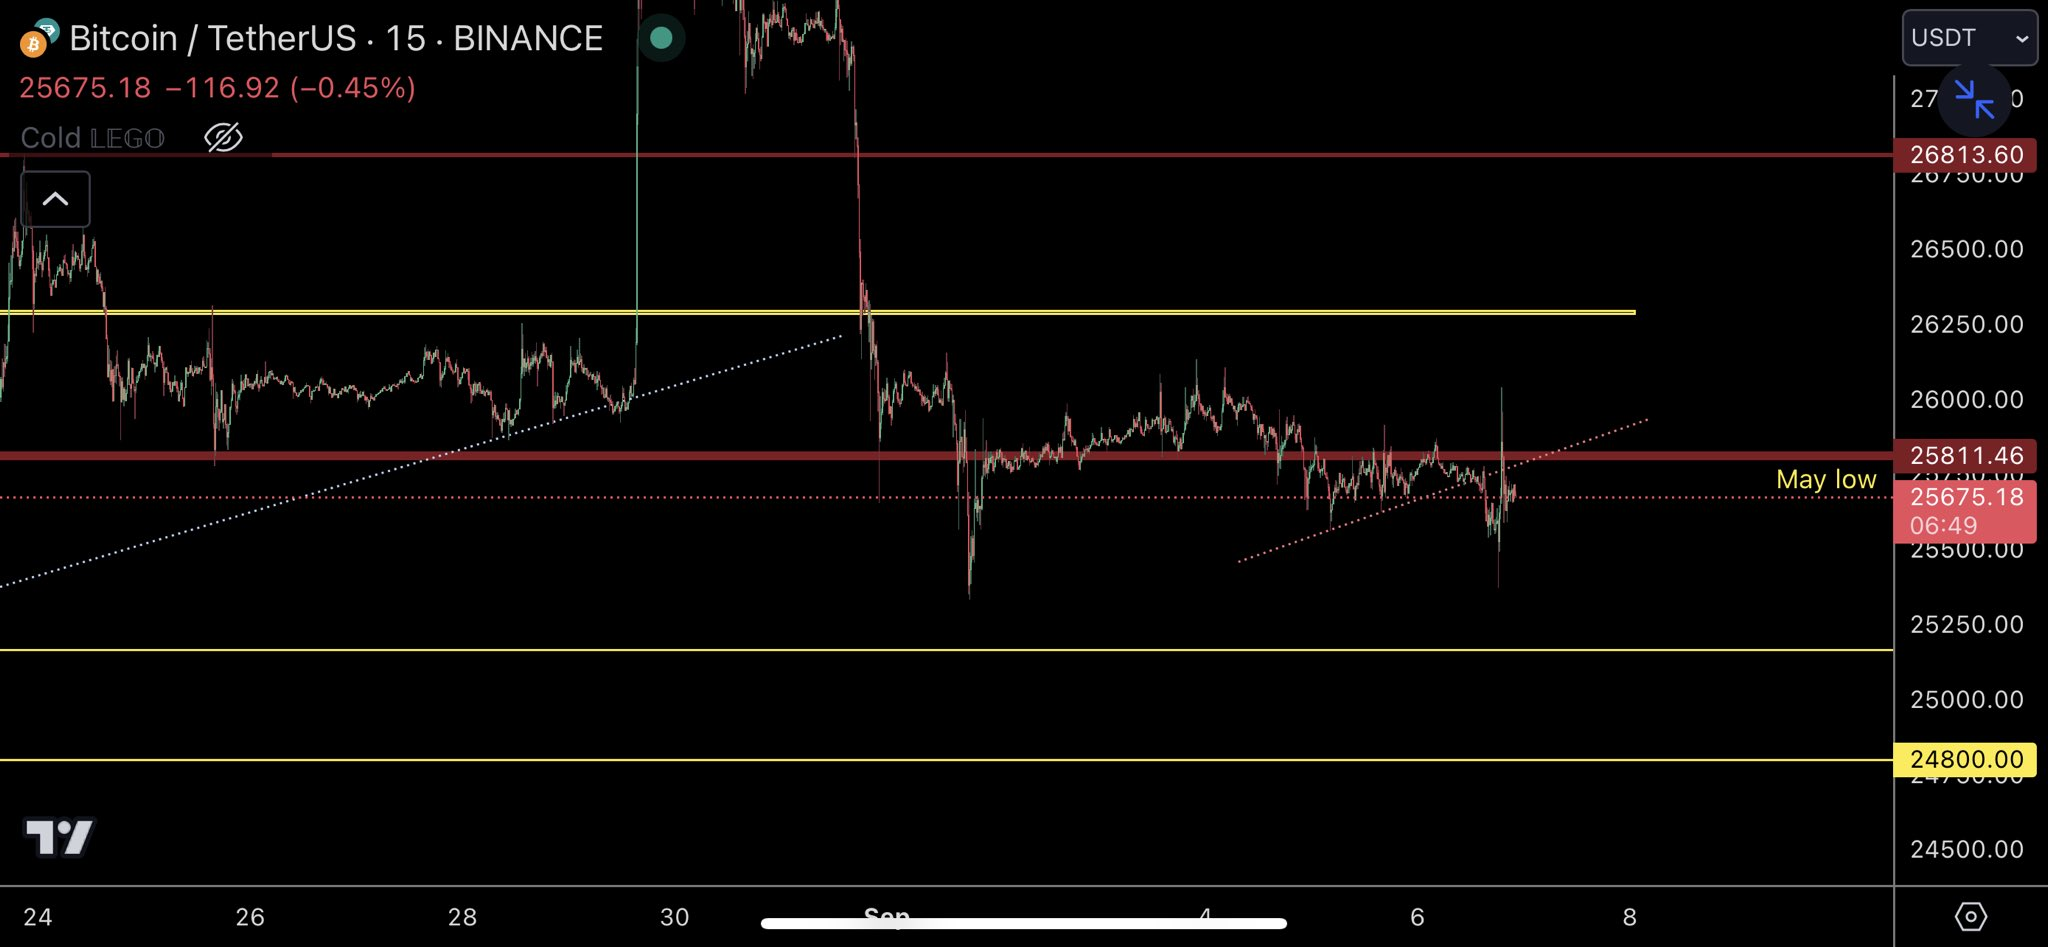 Annotated chart for the BTC/USD pair sourced from TraderSZ on X
Meanwhile, Michaël van de Poppe, the founder and CEO of Eight, a prominent trading firm, singled out the 200-week exponential moving average (EMA) at $25,670 as the critical level to monitor when assessing Bitcoin's performance within weekly timeframes. In a succinct manner, he encapsulated this dilemma as the "million-dollar question" haunting Bitcoin enthusiasts.
 One-week chart displaying BTC/USD with the 200EMA, sourced from TradingView
Taking a more assertive stance, Toni Ghinea, another trader and analyst, confidently projected Bitcoin's descent to $25,000 and beyond, while also anticipating a similar fate for altcoins. In a post on X, he boldly asserted, "I have consistently predicted that we would witness Bitcoin hitting $25k. I've also been vocal about the downward trajectory for altcoins. Now, I am unequivocally stating that $BTC will experience a substantial dip to the range of 19-23k." Ghinea also downplayed the significance of the ongoing tussle over the United States' inaugural Bitcoin spot price exchange-traded fund (ETF), suggesting that it was merely a tool wielded to manipulate the market.
The U.S. dollar amplifies worries in the cryptocurrency and risk asset sectors
Moving beyond the realms of cryptocurrencies, the U.S. dollar put forth compelling arguments for exerting pressure on various risk assets. On September 7, the U.S. Dollar Index (DXY) achieved a remarkable milestone, scaling up to 105.15, a pinnacle it had not reached since March 10.
 One-day chart for the U.S. dollar index (DXY) sourced from TradingView
Benjamin Cowen, an analyst, offered a comprehensive analysis on X, asserting that this robust rally in the dollar would persistently cast a shadow over risk assets, particularly those perched at the upper echelons of the risk spectrum, including cryptocurrencies.
In consonance with this viewpoint, TraderSZ also voiced his concerns, foreseeing a potential downturn in U.S. equities stemming from the prevailing strength of the DXY.
$ES update. So combining dxy view, where btc and eth are at, and now this. Putting pieces together for now tells me further downside till proven otherwise https://t.co/oHYXhllzcp pic.twitter.com/87H7YhX98c
— TraderSZ (@trader1sz) September 7, 2023
Caleb Franzen, a senior analyst at Cubic Analytics, chimed in, saying, "The price action for the U.S. Dollar Index #DXY appears exceedingly bullish, which consequently bears implications for financial assets." Franzen emphasized the pivotal significance of the DXY's breakthrough above the 200-day moving average cloud and the trendline tracing back to its 2022 highs, which have now assumed the role of sturdy support levels. Accompanying these observations was a graphical representation featuring the DXY's 200-day simple and exponential moving averages.
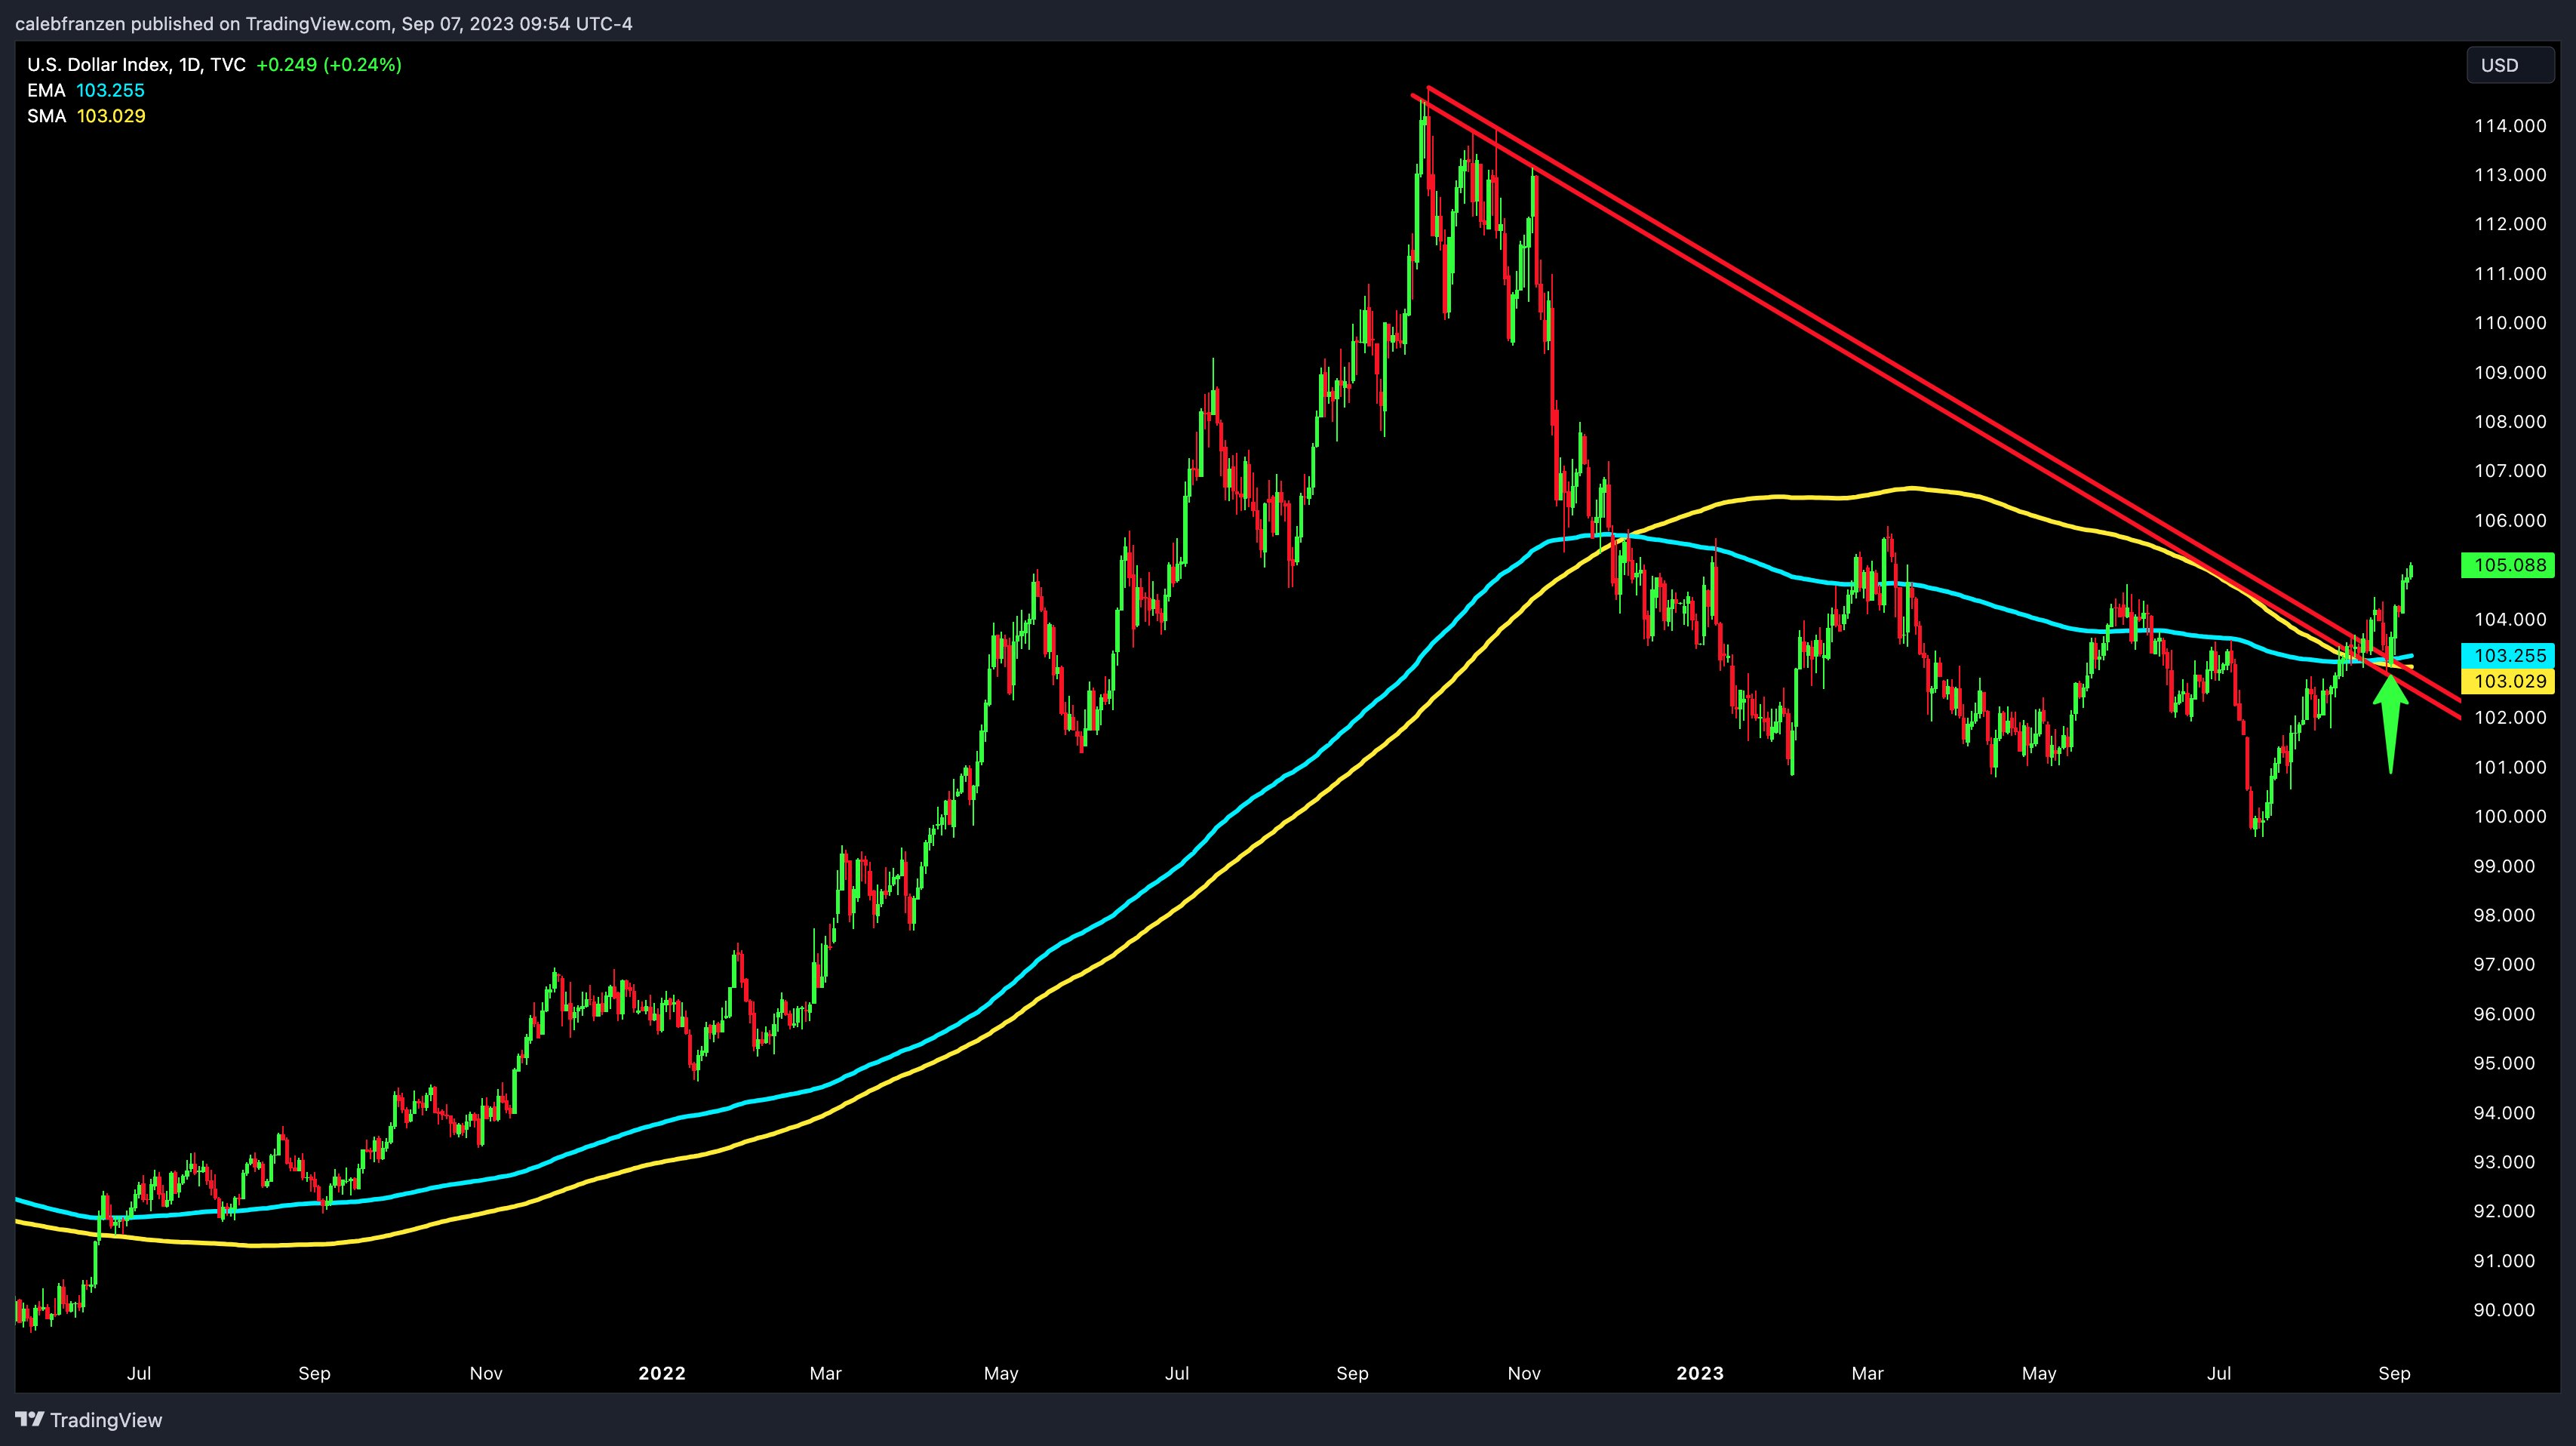
Chart depicting the U.S. Dollar Index (DXY) along with its moving averages, sourced from Caleb Franzen on X

Trending


Press Releases

Deep Dives


